ExplainSpeaking-Economy is a weekly newsletter by Udit Misra, delivered in your inbox every Monday morning. Click here to subscribe
“I am familiar with the sentiments of every part of society in India. And I can say on the basis of my experience and with great confidence that the common man of India is full of positivity. Positivity is part of his nature and his culture. Indian society tolerates negativity, but does not accept it; it is not its nature. The nature of the Indian community is cheerful, a dreamy society,” said the PM. The full text of the speech is available here.
Ordinarily it would be tough to test such a claim — about Indians tolerating negativity but staying cheerful about the future — but on that very day, almost as if on cue, the Reserve Bank of India published its latest instalment of a survey that maps the consumer sentiment across the country. The findings of this survey underscore what the PM said about Indians (see CHART 1).
 Chart 1: Indian consumer confidence has been negative even though at all times the future expectation has been positive
Officially the survey is called the Consumer Confidence Survey (CCS). The CCS asks people across 19 cities about their current perceptions (vis-à-vis a year ago) and one-year ahead expectations on the general economic situation, employment scenario, overall price situation and own income and spending. The latest round of the survey was conducted from January 02 to 11, 2023, and covered 6,047 respondents.
CHART 1 summarises the findings of the CCS. It plots two indices. The first one is the current situation index (CSI); or how consumers feel via-a-vis a year ago. The second one is the future expectations index (FEI); or how consumers expect things to be a year ahead.
CSI and FEI are compiled on the basis of “net responses” on the following variables: general economic situation, income levels, spending levels, employment situation and the price level for the current period (as compared with one year ago) and a year ahead, respectively.
In terms of a simple formula:
Story continues below this ad
CSI or FEI = 100 + Average of Net Responses of the above parameters.
For example, in trying to understand how Indians currently view the price level, the respondents are asked whether the price level has increased from a year ago or decreased or remained the same. Suppose, 50% of respondents say it remains the same, 30% say it has increased and the remaining 20% say that it has decreased then the “net response” is minus 10%. Simply put, a net response is arrived at by taking the difference between the percentage of respondents that say the situation has improved and the percentage of respondents that say the situation has worsened.
As such, a value below 100 shows negative consumer confidence.
So what CHART 1 shows is that for the most part since early 2015, Indian consumer confidence has been negative even though at all times the future expectation has been positive. To be sure, the current consumer confidence after the December 2016 round, has never been positive barring one occasion — just before the 2019 Lok Sabha election. In stark contrast, barring two occasions, Indian consumers’ future expectations have always been positive over the same period. This follows pretty closely with the point PM Modi made.
What has led to consumer confidence being so low?
There are five key variables — general economic situation, employment scenario, price level, household income and overall spending — that determine the overall CSI index value.
Story continues below this ad
Let’s look at how consumers replied to each of these variables.
1: Consumer sentiment on general economic situation
CHART 2 shows how consumers saw the general economic situation since late 2012. Again, barring a period of two years between December 2014 and December 2016, Indian consumers have mostly been felt negatively. The only other exception, albeit a very brief one, is the time before the 2019 general election. Although, it must be noted that the consumers are feeling less negative in January 2023 than they did over the past three years.
Chart 2: Indian consumer’s perception of the general economic situation since late 2012
2: Consumer sentiment on price level
CHART 3 maps this rather deeply negative outcome. For one, there’s never been a time since these surveys started in 2012 when consumers felt the price level was lower than a year ago. An overwhelming percentage of people replied by saying that prices were higher than a year ago.
Story continues below this ad
3: Consumer sentiment on the employment situation
CHART 4 shows that when consumers were finding price levels worsening, they also found the employment situation worsening for them. In fact, the sentiment on jobs has steadily worsened over the years before it sank altogether in the wake of the Covid-19 pandemic.
Chart 4: Indian consumer’s perception of the employment status
4: Consumer sentiment on income
CHART 5 shows how consumers responded by claiming that their incomes have been lower than a year ago and that this negative trend had set in even before the Covid-19 pandemic. The recovery of this sentiment, however, has been no less remarkable but it still remains in the negative territory.
Story continues below this ad
5: Consumer sentiment on spending
While the overall index (CSI) looks at the overall spending, CHART 6 here tracks the consumer sentiment vis-a-via the spending on non-essential items. These items such as leisure travel and eating out capture how Indian consumer sentiment is.
Chart 6: Indian consumer’s perception of spending on non-essential items
As CHART 6 shows, consumers started becoming less and less positive about non-essential spending since the start of 2018. By mid-2019, the sentiment had turned negative. This was the time when the slowdown in auto/car sales started becoming front-page news. Since then the situation only got worse in the wake of the Covid pandemic. But even now — almost three years since the first lockdown was announced, the consumer sentiment on non-essential items remains negative.
It merits remembering that even though it is not shown in all the charts, the future expectation of consumers across all variables — barring price level — remains positive. In other words, while it is true that for years on end, Indians continue to find that their current situation is much worse than what it was a year ago, they also continue to expect that in a year’s time, all will be better.
Story continues below this ad
Share your views and queries on udit.misra@expressindia.com
Until next week,
Udit

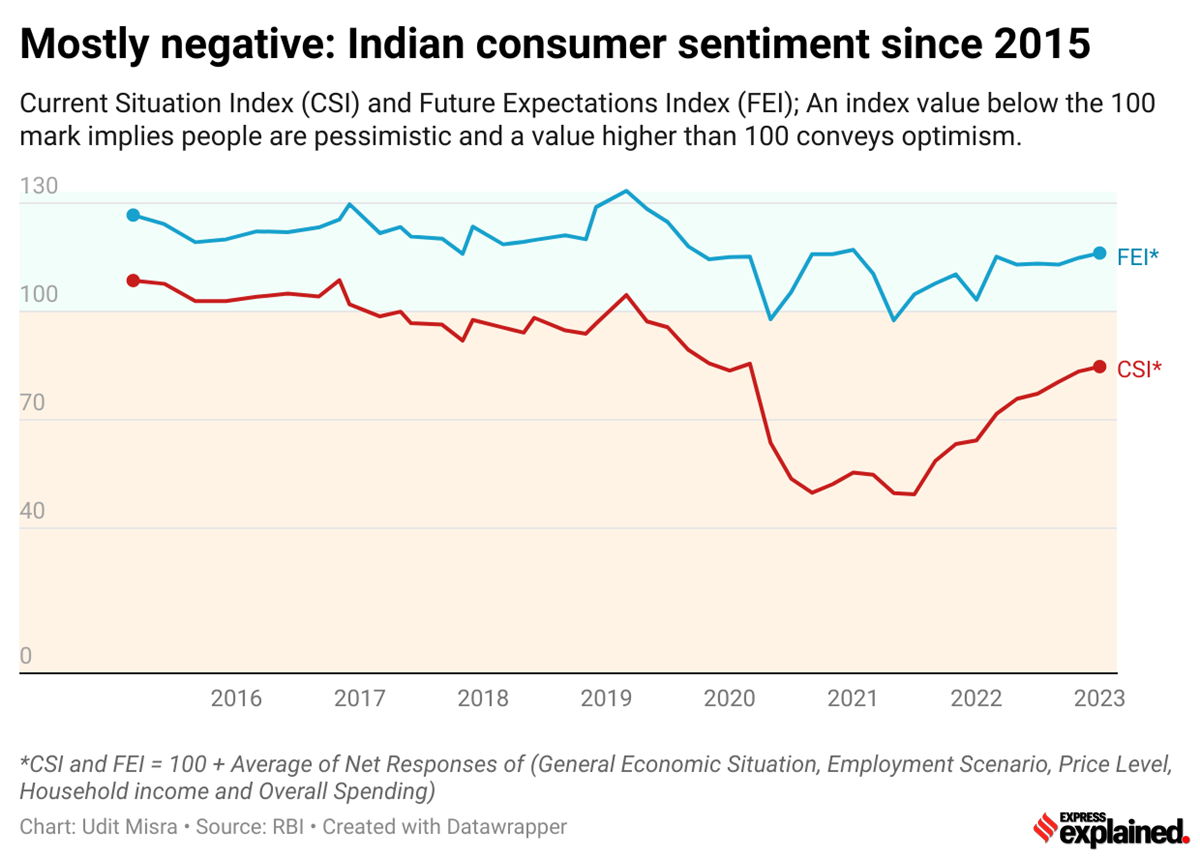 Chart 1: Indian consumer confidence has been negative even though at all times the future expectation has been positive
 Chart 2: Indian consumer’s perception of the general economic situation since late 2012
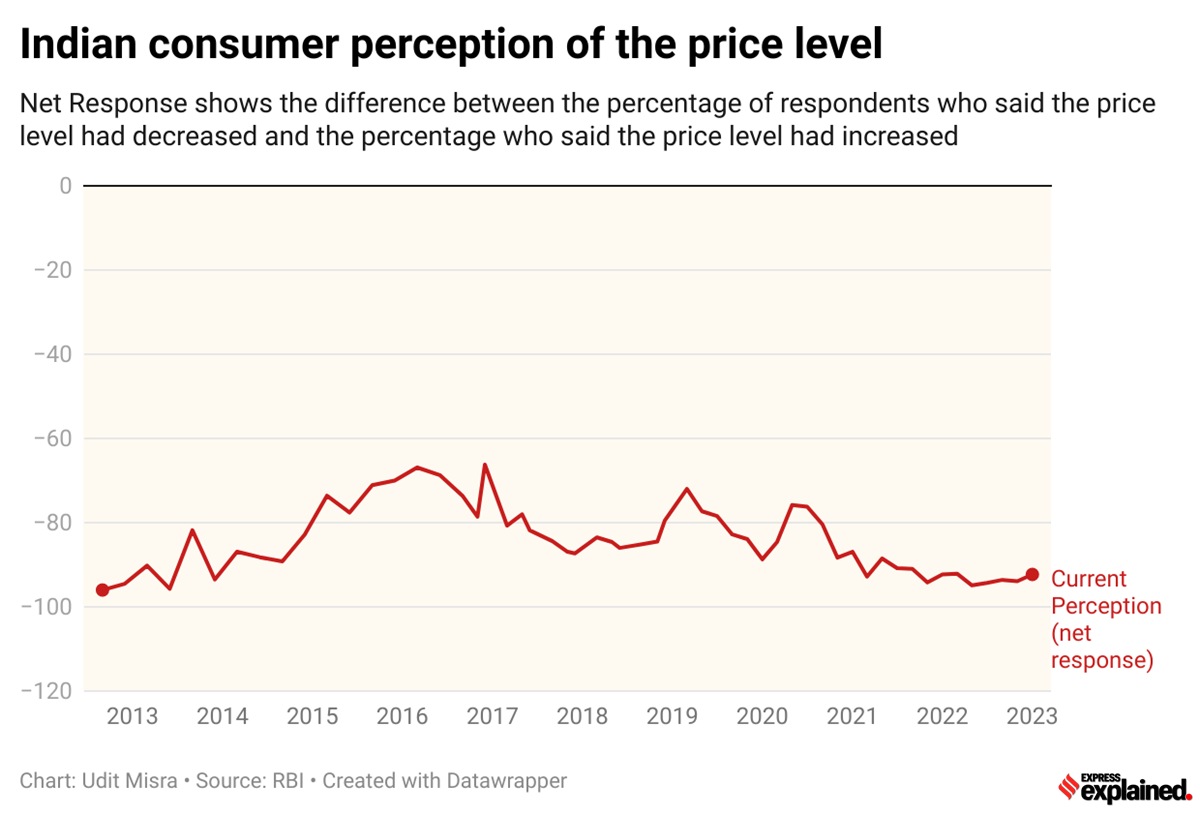 Chart 3: Indian consumer’s perception of the price level
 Chart 4: Indian consumer’s perception of the employment status
 Chart 5: Indian consumer’s perception of their income
 Chart 6: Indian consumer’s perception of spending on non-essential items