GDP: What’s the link between inequality and public education?
In this week’s column ‘GDP: Graphs, Data, Perspectives’, we look at the World Inequality Report for 2026. Among other things, it shows that the top 10% of the global population’s income-earners earn more than the remaining 90%.
New Delhi | Updated: December 13, 2025 07:41 AM IST
3 min read
Whatsapp
twitter
Facebook
Reddit
Slums and high-rise buildings in Mumbai, India. (Photo: Reuters)
The World Inequality Report for 2026, released this week, underscores the widening inequalities not just within a country but also in the world as a whole. Data show that the top 10% of the global population’s income-earners earn more than the remaining 90%, while the poorest half of the global population captures less than 10% of the total global income. Wealth is even more concentrated: the top 10% own three-quarters of global wealth, while the bottom half holds only 2%.
The global averages conceal enormous divides between regions, states the report. The world is split into clear income tiers (see CHART 1): high-income regions such as North America & Oceania, and Europe; middle-income groups, including Russia & Central Asia, East Asia, and the Middle East & North Africa; and very populous regions where average incomes remain low, such as Latin America, South & Southeast Asia (this is where India falls), and Sub-Saharan Africa.
CHART 1
What CHART 1 data show is the sharp contrasts, even after correcting for price differences across regions. “An average person in North America & Oceania earns about thirteen times more than someone in Sub-Saharan Africa and three times more than the global average. Put differently, average daily income in North America & Oceania is about €125, compared to only €10 in Sub-Saharan Africa. And these are averages: within each region, many people live with far less,” states the report.
Often, the basic questions — whether there is inequality, and if so, how severe — are deeply contested. Readthis editionof ExplainSpeaking to understand the situation in India’s context.
This often means that the more substantive issues do not get the required attention. For instance, the type of policies that can reduce the yawning gap of inequalities. The WIR 2026 lays out many, but here’s the top one: Public investments in education and health. “These are among the most powerful equalizers, yet access to these basic services remains uneven and stratified. Public investment in free, high-quality schools, universal healthcare, childcare, and nutrition programs can reduce early-life disparities and foster lifelong learning opportunities. By ensuring that talent and effort, rather than background, determine life chances, such investments build more inclusive and resilient societies,” says the report.
To be sure, “public investment” means the expenditure by governments towards education.
It is instructive to note where each of the above-mentioned regions shows up on public education expenditure (see CHART 2). “In 2025, average public education expenditure per school−age individual (0−to−24−year−old) varies enormously across world regions, from €220 in Sub−Saharan Africa to €9,025 in North America & Oceania (PPP € 2025), i.e., a gap of almost 1 to 41.”
Story continues below this ad
CHART 2
Is it any surprise that laggard regions continue to lag?
Udit Misra is Senior Associate Editor at The Indian Express. Misra has reported on the Indian economy and policy landscape for the past two decades. He holds a Master’s degree in Economics from the Delhi School of Economics and is a Chevening South Asia Journalism Fellow from the University of Westminster.
Misra is known for explanatory journalism and is a trusted voice among readers not just for simplifying complex economic concepts but also making sense of economic news both in India and abroad.
Professional Focus
He writes three regular columns for the publication.
ExplainSpeaking: A weekly explanatory column that answers the most important questions surrounding the economic and policy developments.
GDP (Graphs, Data, Perspectives): Another weekly column that uses interesting charts and data to provide perspective on an issue dominating the news during the week.
Book, Line & Thinker: A fortnightly column that for reviewing books, both new and old.
Recent Notable Articles (Late 2025)
His recent work focuses heavily on the weakening Indian Rupee, the global impact of U.S. economic policy under Donald Trump, and long-term domestic growth projections:
Currency and Macroeconomics:
"GDP: Anatomy of rupee weakness against the dollar" (Dec 19, 2025) — Investigating why the Rupee remains weak despite India's status as a fast-growing economy.
"GDP: Amid the rupee's fall, how investors are shunning the Indian economy" (Dec 5, 2025).
"Nobel Prize in Economic Sciences 2025: How the winners explained economic growth" (Oct 13, 2025).
Global Geopolitics and Trade:
"Has the US already lost to China? Trump's policies and the shifting global order" (Dec 8, 2025).
"The Great Sanctions Hack: Why economic sanctions don't work the way we expect" (Nov 23, 2025) — Based on former RBI Governor Urjit Patel's new book.
"ExplainSpeaking: How Trump's tariffs have run into an affordability crisis" (Nov 20, 2025).
Domestic Policy and Data:
"GDP: New labour codes and opportunity for India's weakest states" (Nov 28, 2025).
"ExplainSpeaking | Piyush Goyal says India will be a $30 trillion economy in 25 years: Decoding the projections" (Oct 30, 2025) — A critical look at the feasibility of high-growth targets.
"GDP: Examining latest GST collections, and where different states stand" (Nov 7, 2025).
International Economic Comparisons:
"GDP: What ails Germany, world's third-largest economy, and how it could grow" (Nov 14, 2025).
"On the loss of Europe's competitive edge" (Oct 17, 2025).
Signature Style
Udit Misra is known his calm, data-driven, explanation-first economics journalism. He avoids ideological posturing, and writes with the aim of raising the standard of public discourse by providing readers with clarity and understanding of the ground realities.
You can follow him on X (formerly Twitter) at @ieuditmisra
... Read More

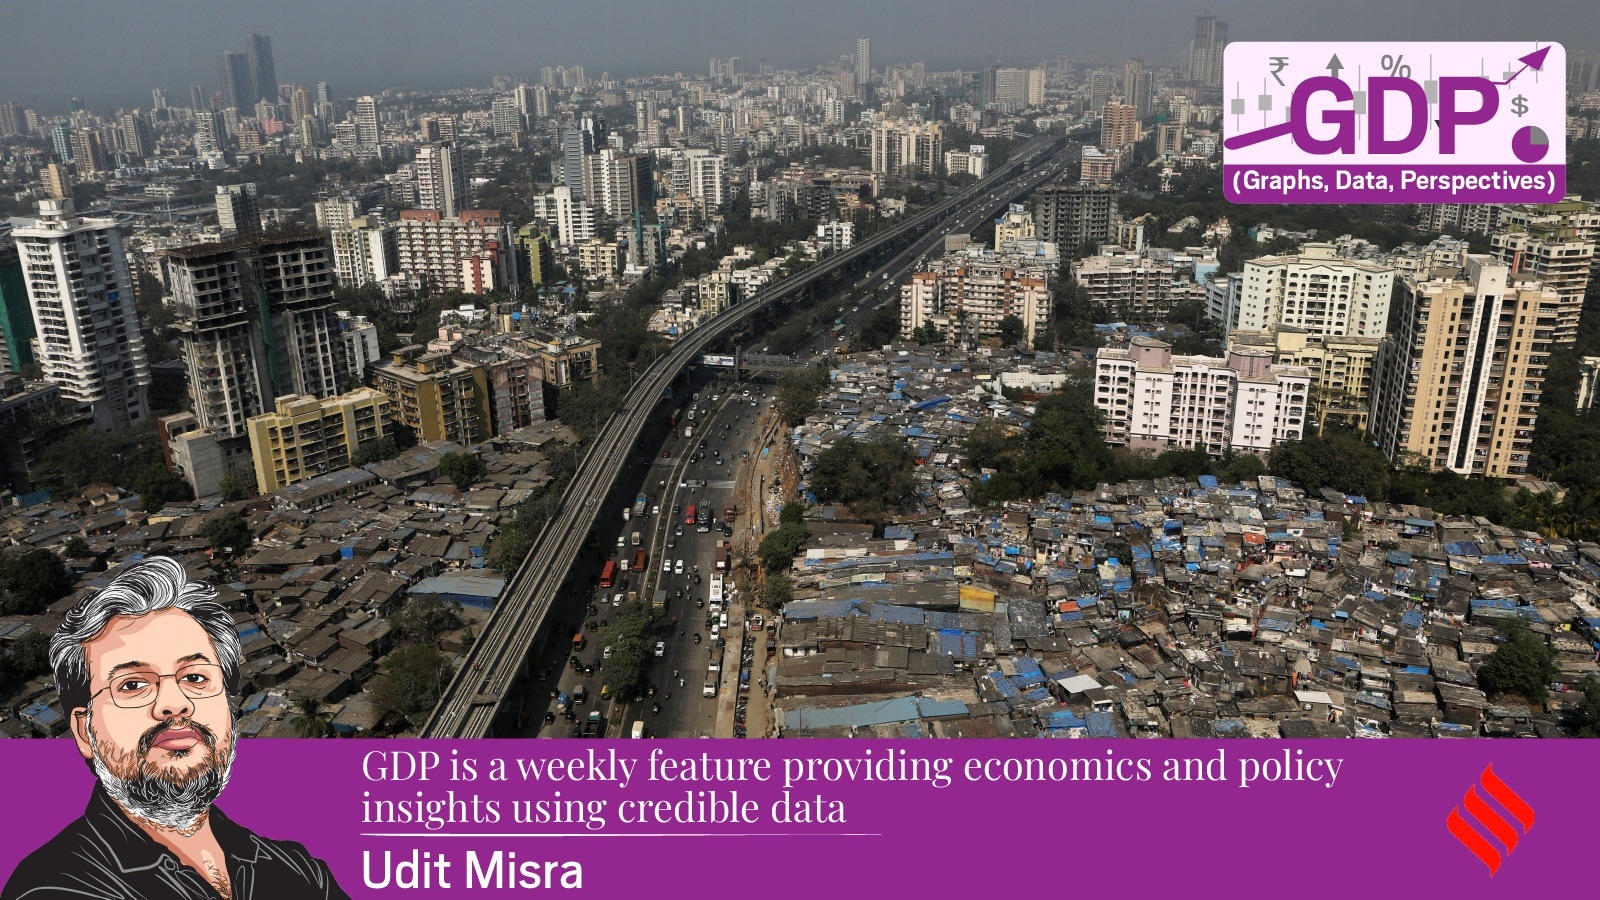
 CHART 1
 CHART 2