ExplainSpeaking | Tax cuts and other budget allocations: Why there is no free lunch
Budget Allocations Explained: It is an open question whether income tax cuts for those earning five to six times more than the average Indian is the best way to use taxpayer money to incentivise long-term growth. Take a look at some crucial data points in this explainer.
New Delhi | Updated: February 8, 2025 06:58 AM IST
9 min read
Whatsapp
twitter
Facebook
Reddit
Union Finance Minister Nirmala Sitharaman speaks in the Rajya Sabha during the Budget session of Parliament, in New Delhi, Tuesday, Feb. 4, 2025. (PTI Photo)
Dear Readers,
Budget Allocations Explained: The Union Budget for 2025-26 was presented last Saturday (February 1) and it provided a whopping Rs 1 lakh crore (that is, Rs 1 trillion) tax relief to income taxpayers of the country. The hope is that this hefty amount of money left in the pockets of the taxpayers will boost consumption demand and thus push up India’s economic (that is, GDP) growth rate above the 6% level.
Governments can influence the overall GDP growth through their taxation and expenditure policies, together clubbed as “fiscal policy”. Taxing less leaves consumers with more money to spend and thus trigger economic activity. Similarly, spending more on creating productive assets (called capital expenditure) relative to spending on everyday expenses such as salaries (also called current or revenue expenditure) also helps overall GDP growth. In this Budget, the Union government did both these things.
Yet a closer inspection of the Budget numbers suggests that, notwithstanding the enormity of the tax bonanza, the overall impact on growth — also called the fiscal impulse of the Union Budget — may be negative or at best neutral. At least two independent research agencies — Nomura and HSBC — have now shown this.
Chart 1
First look at red line CHART 1 by HSBC, which says that the fiscal impulse of the Budget is likely to be negative. This stays true (see the black line in CHART 1) even when one incorporates the improved quality of central government’s expenditure (see CHART 2).
Chart 2
Similarly, Nomura came out with a report on the Budget stating “In the near term, we see the budget as largely neutral for growth”. They further stated (See CHART 3) that “our estimates suggest a minimal fiscal impulse to growth”.
Chart 3
What is noteworthy in both CHARTS 1 (by HSBC) and 3 (by Nomura) is that the fiscal impulse has been negative or neutral in most of the years following the Covid pandemic year of 2020-21. In other words, the economic recovery in the post Covid years had little to do with Union Budgets providing some impetus. As of the next year’s Budget, the story remains the same.
Story continues below this ad
Looking back at Budget priorities of the past decade
That brings us to the topic of analysis this week: Revisiting the Union Budget, its size and priorities of spending and seeing it in relation to what happened to the finances of an average Indian and India’s corporate sector. The period in question is 2014-15 to 2024-25. For corporate sales and profit, data is available only till 2023-24. The data is presented in TABLE 1. Unless otherwise stated, all data is in lakh crore to provide natural context for government’s spending priorities by comparing it to the Rs 1 lakh crore tax relief.
The idea is to understand the rate at which the economy grew — both the overall GDP as well as the incomes and expenditures of average Indians and the corporate sector — and compare it with the rate at which the Union Budget (essentially the size of the central government’s expenditure) and its key components grew over the past 10 years — that is financial years 2016 to 2025.
The data for FY15 is taken as the base. While the budget for FY15 was the first one under Prime Minister Modi, it wasn’t a full-fledged Budget since it was presented well after the financial year had started.
TABLE 1: Looking back at Union Budgets (FY15 to FY25)
(All data in Lakh crore unless otherwise stated)
2014-15
2024-25
Annual Growth Rate*
Nominal GDP of India
124.7
324
10%
Nominal GDP of average Indian (in Rs)
98,405
2,30,195
8.9%
Nominal Expenditure of average Indian (in Rs)
57,201
1,42,256
9.5%
Corporate sales@#
103.3
156.7
4.7%
Corporate profits@#
2.43
11.06
18.3%
Size of the Union Budget
16.6
50.7
11.8%
Budget expenditure on Education
0.69
1.14
5.2%
Budget expenditure on Skill Development^
0.01
0.03
14.1%
Budget expenditure on Health and Family Welfare
0.31
0.89
11.1%
Budget Expenditure on MG-NREGA
0.33
0.86
10.1%
Budget Expenditure on Food subsidy
1.15
1.97
5.5%
Capital expenditure in the Budget
1.97
10.2
17.9%
Fiscal Deficit or amount of money borrowed by the government
India’s annual GDP has grown at the rate of 10% in nominal terms (that is, inclusive of inflation). In comparison, the per capita GDP (or the average income of an Indian) has grown only at the rate of 8.9%. However, at 9.5%, the average Indian’s expenditure grew faster than his or her income.
The size of the Union Budget or the rate at which government spending expanded (11.8%) is higher than the rate of nominal GDP growth rate. It is for this reason that the Budget as a percentage of GDP was only 13.31% in FY15 and expanded to 15.65% in FY25. This runs contrary to at least half of Prime Minister Narendra Modi’s slogan “Minimum Government, Maximum Governance”.
The performance of corporate India is also noteworthy. Data from CMIE for non-financial companies shows that while their annual sales only grew at a feeble rate of 4.7% — less than half the rate of nominal GDP growth — their profits soared, growing at over 18% annually. The contrast between the fortunes of an average Indian and corporate India is striking.
Within the Central Government’s Budget priorities, to arrive at a fuller understanding it is important to look at both the size of the expenditure on a particular sector as well as the rate of growth in its allocation. This can be best seen with the example of Education and Skill Development. On Education, for example, the Union Government’s allocation went from Rs 69,000 crore (or 0.69 Lakh crore) in FY15 to Rs 1.14 lakh crore in FY25. This is a paltry annual growth of just 5.2%, especially when the overall budget has grown at 11.8%. As a result, Union Budget allocation for education fell from being 4% of the total budget to just 2.2% in the past decade. On Skill Development, while the allocations have grown at an annual rate of more than 14%, the fact is that the total amount allocation is quite low. It was 0.01 lakh crore in FY16 and has grown to 0.03 lakh crore in FY25; that’s 0.06% of total Budget in the current financial year.
Budget expenditures on Health and Family Welfare is even lower than education. While the allocation has grown at a rate almost in sync with the overall size of the Budget, the fact is that despite this increase, the allocation is just 1.7% of the total government expenditure.
Allocation to MG-NREGA, the rural employment programme, has a trajectory similar to the allocation on health.
Expenditure towards providing food subsidy, notwithstanding the increased help during Covid, have only grown by 5.5% annually over the past decade.
Allocations to capital expenditure show why it is the hallmark of this government. They have registered an increase of almost 18% — far in excess of either nominal GDP or the size of the Budget itself. The only variable that has grown faster than the government’s capex is corporate profits. As of FY25, capex stands at over 20% of all expenditures.
Lastly, the fiscal deficit (or the amount of money the government has to borrow each year to meet the gap between its expenditure and earnings) has grown at a rate faster than the rate of growth of the Union Budget or the GDP. That is why it has grown from 4.1% of GDP in FY15 to 4.8% in FY25. It is noteworthy that, even though he is seen as the fiscal hawk, the Modi government has not once met the fiscal prudence norm of restricting this deficit to 3% of GDP.
Upshot
The data above shows that there is no free lunch. In other words, when governments provide historic tax reliefs — such as the income tax cut for next year or the corporate tax cut in 2019 — what often gets ignored are the cut in allocation to other sectors. The chronically low levels of budget allocations on education, skill development and health, for instance, are a case in point, especially at a time when Artificial Intelligence, and the countries (read China) leading it, threaten India’s growth and job prospects.
It is an open question whether income tax cuts for those earning five to six times more than the average Indian is the best way to use taxpayer money to incentivise long-term growth. It is also noteworthy that this tax “rebate” effectively shrinks India’s tax base at a time when many have argued that India should be expanding it in order to bring down tax burden on all.
Does India need a rethink on how it allocates its Budget? Where would you increase allocation in the Union Budget?
Udit Misra is Senior Associate Editor at The Indian Express. Misra has reported on the Indian economy and policy landscape for the past two decades. He holds a Master’s degree in Economics from the Delhi School of Economics and is a Chevening South Asia Journalism Fellow from the University of Westminster.
Misra is known for explanatory journalism and is a trusted voice among readers not just for simplifying complex economic concepts but also making sense of economic news both in India and abroad.
Professional Focus
He writes three regular columns for the publication.
ExplainSpeaking: A weekly explanatory column that answers the most important questions surrounding the economic and policy developments.
GDP (Graphs, Data, Perspectives): Another weekly column that uses interesting charts and data to provide perspective on an issue dominating the news during the week.
Book, Line & Thinker: A fortnightly column that for reviewing books, both new and old.
Recent Notable Articles (Late 2025)
His recent work focuses heavily on the weakening Indian Rupee, the global impact of U.S. economic policy under Donald Trump, and long-term domestic growth projections:
Currency and Macroeconomics:
"GDP: Anatomy of rupee weakness against the dollar" (Dec 19, 2025) — Investigating why the Rupee remains weak despite India's status as a fast-growing economy.
"GDP: Amid the rupee's fall, how investors are shunning the Indian economy" (Dec 5, 2025).
"Nobel Prize in Economic Sciences 2025: How the winners explained economic growth" (Oct 13, 2025).
Global Geopolitics and Trade:
"Has the US already lost to China? Trump's policies and the shifting global order" (Dec 8, 2025).
"The Great Sanctions Hack: Why economic sanctions don't work the way we expect" (Nov 23, 2025) — Based on former RBI Governor Urjit Patel's new book.
"ExplainSpeaking: How Trump's tariffs have run into an affordability crisis" (Nov 20, 2025).
Domestic Policy and Data:
"GDP: New labour codes and opportunity for India's weakest states" (Nov 28, 2025).
"ExplainSpeaking | Piyush Goyal says India will be a $30 trillion economy in 25 years: Decoding the projections" (Oct 30, 2025) — A critical look at the feasibility of high-growth targets.
"GDP: Examining latest GST collections, and where different states stand" (Nov 7, 2025).
International Economic Comparisons:
"GDP: What ails Germany, world's third-largest economy, and how it could grow" (Nov 14, 2025).
"On the loss of Europe's competitive edge" (Oct 17, 2025).
Signature Style
Udit Misra is known his calm, data-driven, explanation-first economics journalism. He avoids ideological posturing, and writes with the aim of raising the standard of public discourse by providing readers with clarity and understanding of the ground realities.
You can follow him on X (formerly Twitter) at @ieuditmisra
... Read More

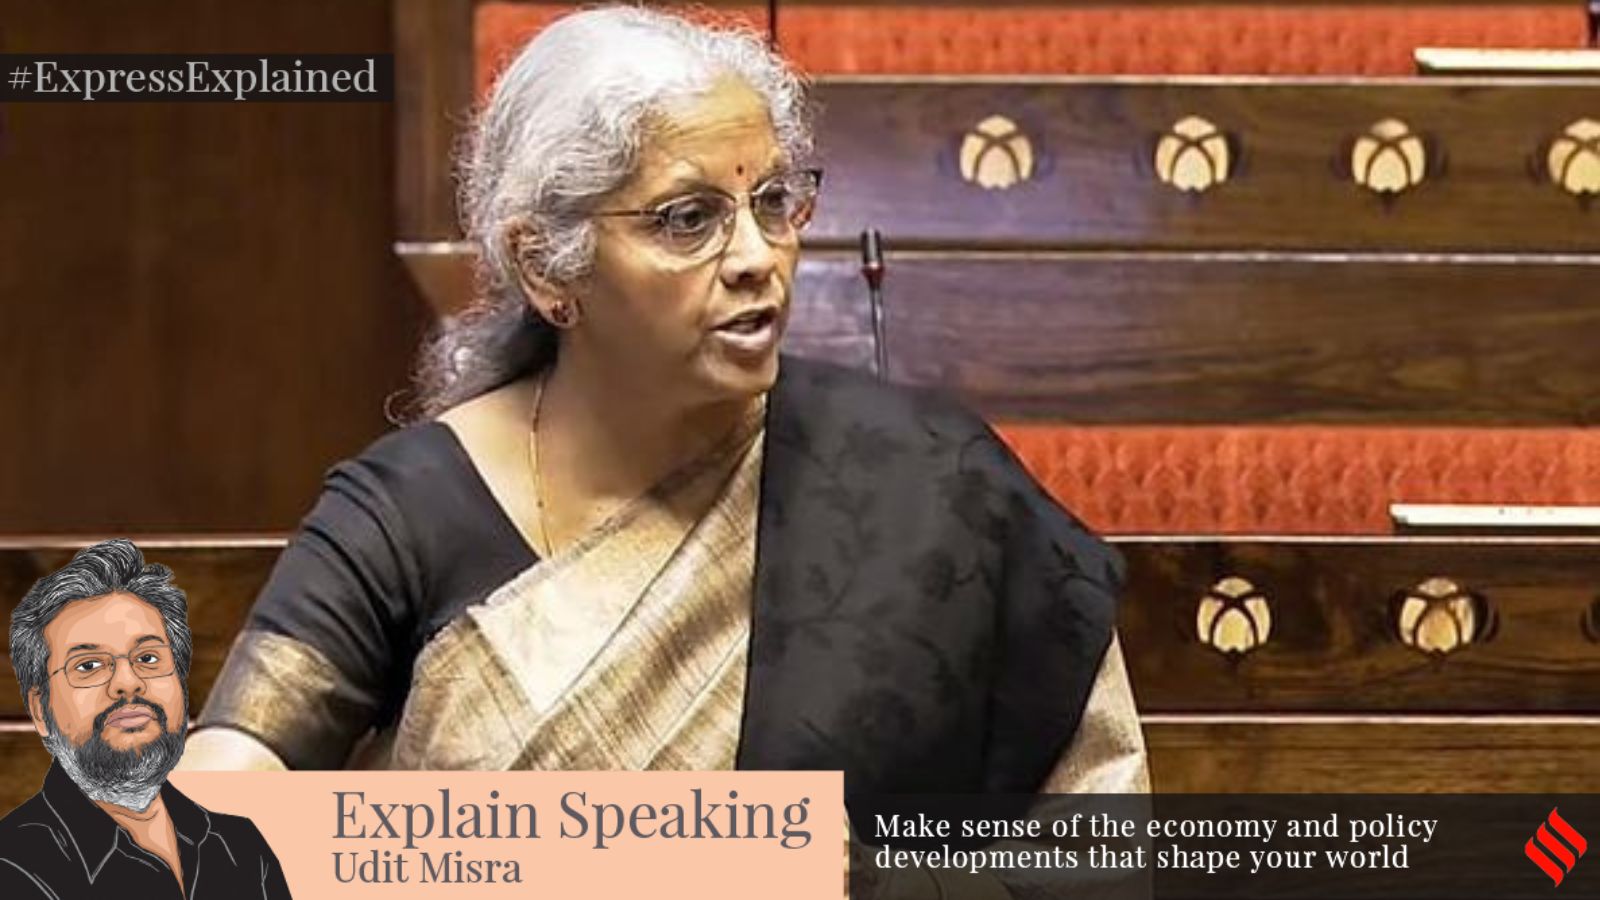
 Chart 1
 Chart 2
 Chart 3