Over the past few weeks and months there have been several stories about how extreme weather events (such as unexpected rainfall or unusually high temperatures) have disrupted normal life in India. There is also a constant reminder that more of the same can be expected with each passing year. To be sure, the Global Climate Risk Index 2021 had ranked India seventh in the list of most affected countries in terms of exposure and vulnerability to climate risk events.
Some obvious and associated questions include: What is the economic cost of climate change? How vulnerable is India’s economy to such climate change? What will happen to our GDP and inflation if timely action is not taken to address climate concerns?
In its latest report of currency and finance, the RBI (India’s central bank) has a chapter dedicated to answering many of these questions and explaining the macroeconomic effects of climate change in India.
What is the evidence of climate change?
The most obvious signs of climate change are the anomalies in temperature and precipitation (rain, hail, snow etc.)
Look at Chart 1 for the average annual temperature in India. While annual average temperature in India has been increasing gradually, the rise has been significantly sharper during the last vicennial (twenty years) than during any other 20-year time interval since 1901 finds the RBI paper.
 Chart 1: The average annual temperature in India
Similarly, the south west monsoon, too, has been becoming more erratic.
Story continues below this ad
“Notably, while the average annual rainfall at the all-India level during the last vicennial (2000-2020) saw a rise over that during 1960-1999, over a longer time horizon since 1901, annual average rainfall in India has gradually declined…Moreover, evidence suggests that while dry spells have become more frequent during the last several years, intense wet spells have also increased,” finds RBI’s research.
Research about natural disasters since 1975 has shown that India is relatively more exposed to floods and storms (i.e., cyclones and hailstorms) than droughts and heatwaves. “Such incidences pose significant risks to agricultural production and food price volatility,” states the RBI.
How vulnerable is India to climate change?
There are two ways to analyse this. One by looking at India’s geographical attributes and the other by looking at the structure of India’s economy.
As Chart 2 brings out, India’s diverse topography is not only exposed to different temperature and precipitation patterns, but also makes it vulnerable to extreme weather events posing wide-ranging spatial and temporal implications for the economy.
Story continues below this ad
India’s economic structure has undergone a considerable change since Independence. As such, bulk of the economic activity now happens in the services sector as against the agriculture and allied sectors. This has significant implications for carbon emissions (look at Chart 3) because services are “globally considered to be emission-light with relatively lower energy intensity of output”.
Chart 3: A look at CO2 emissions in India
At the Table 1 of a sectoral break-up shows that metal industries, electricity and transports — all highlighted — are the highest emission-intensive sectors, together accounting for around 9 per cent of India’s total GVA (gross value added) in 2018-19.
Table 1: Sector-wise share of CO2 emissions in India
In other words, the sectoral composition of the Indian economy helps reduce its carbon emissions. However, notwithstanding this, fossil fuels have an overwhelmingly large share in India’s primary energy consumption and this fact needs to change (see Chart 4).
Chart 4: The role of fossil fuels in India’s energy consumption
What is the macroeconomic impact of climate change on India?
Climate change can adversely impact both the supply side (read the productive potential) as well as the demand side. It can stroke inflation, reduce economic output, trigger uncertainty and change consumer behaviour.
Story continues below this ad
Over the years, there have been several predictions and assessments made about the impact of climate change on India’s economy. Some are listed below:
1> According to Niti Aayog in 2019, around 600 million of India’s population are facing severe water stress, with 8 million children below 14 years in urban India at risk due to poor water supply.
2> The World Bank in 2020 said that India could account for 34 million of the projected 80 million global job losses from heat stress associated productivity decline by 2030.
3> The IPCC Working Group in 2022 stated that India is one of the most vulnerable countries globally in terms of the population that would be affected by the sea level rise. By the middle of the present century, around 35 million people in India could face annual coastal flooding, with 45-50 million at risk by the end of the century.
Story continues below this ad
Typically the risks from climate change are categorised in two main ways. One is the physical risks and these include chronic issues (such as a gradual and sustained change in temperature and precipitation) as well as acute events such as extreme weather occurrences).
The second category of risks are called transition risks; simply put, these refer to economy-wide changes arising from the transition towards a low-carbon economy. This is best encapsulated by a paradox called “success is failure”. This phrase was used by Mark Carney, Governor of the Bank of England, in 2016. Carney meant that if the shift towards becoming a low-carbon economy is too rapid, it could materially damage a country’s financial stability.
Can policies provide some solutions?
The Network of Central Banks and Supervisors for Greening the Financial System (NGFS) have created an analytical framework called the National Institute Global Econometric Model (NIGEM) “to produce policy insights”.
In this model, the researchers looked at how GDP growth rate and inflation would be affected under six different policy stances when compared to the baseline (which is the best case scenario involving no impact of climate change). Table 2 details these six stances.
Story continues below this ad
The following two charts detail how India’s inflation and GDP might be affected under different policy stances.
As Chart 5 brings out, policy actions have a negative impact on India’s GDP no matter what. However, global scenarios of “current policies” and “nationally determined contributions (or NDCs)” have the highest negative impact on output, whereas rapidly moving towards Net Zero by 2050 will contain the hit to GDP.
Chart 5: Policy actions have a negative impact on India’s GDP no matter what
Chart 6 shows the impact on inflation. Here the story is slightly more complicated. Moving towards net zero by 2050 will spike inflation far more in the immediate future than continuing on current policies.
Chart 6: The impact on inflation
Overall, these trade-offs will become sharper as India tries to achieve the twin goals of achieving net zero emissions by 2070 and becoming an advanced economy (which implies higher emissions) by 2047.
Until next week,
Udit

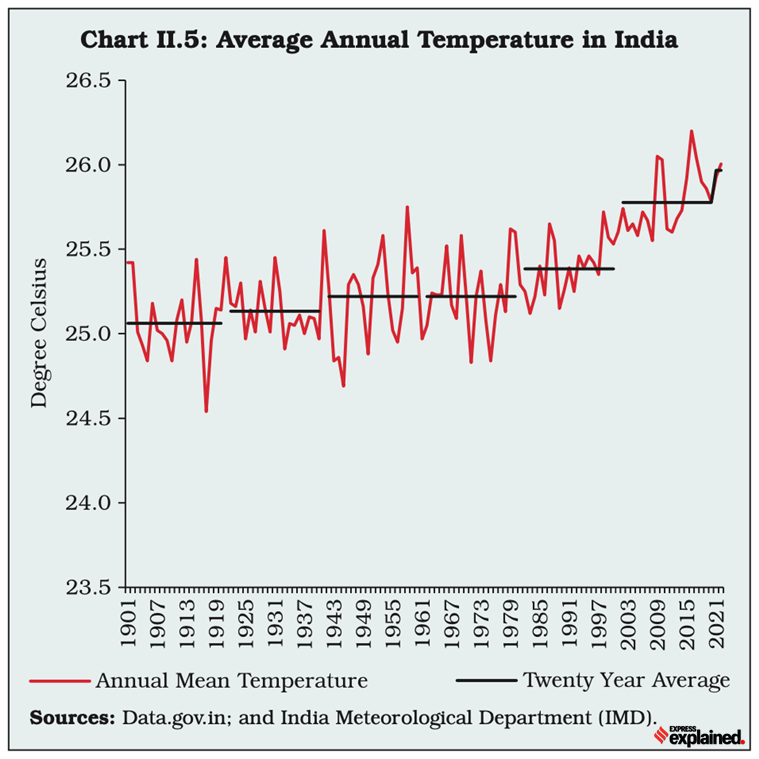 Chart 1: The average annual temperature in India
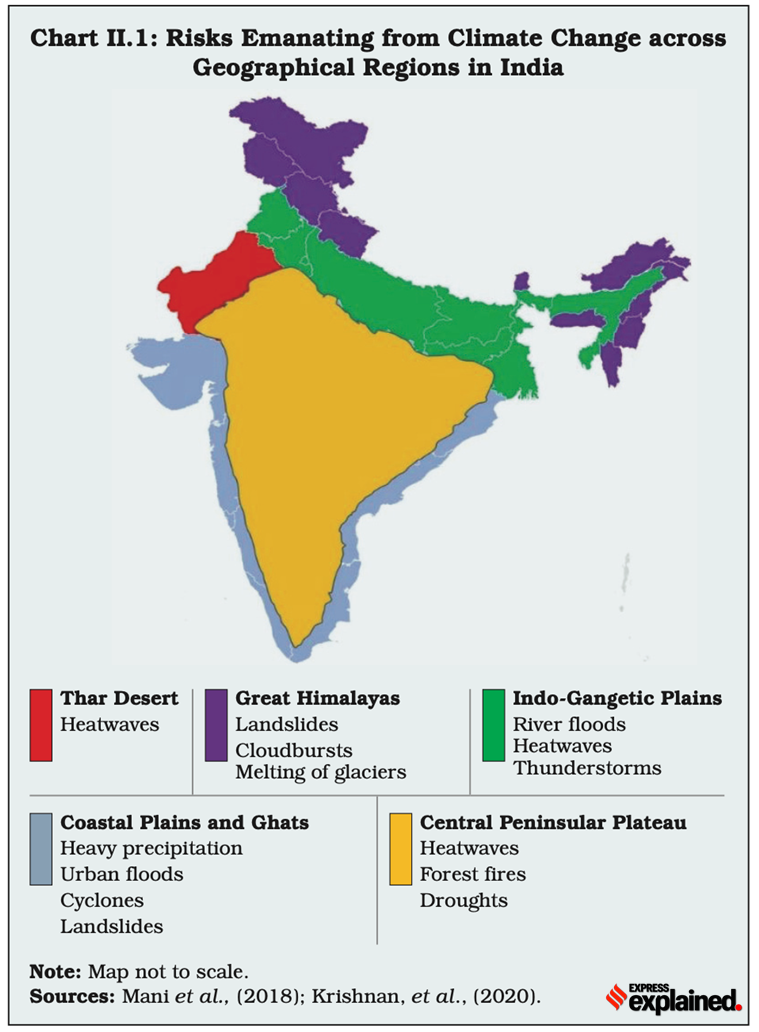 Chart 2: How different regions may be affected by climate change
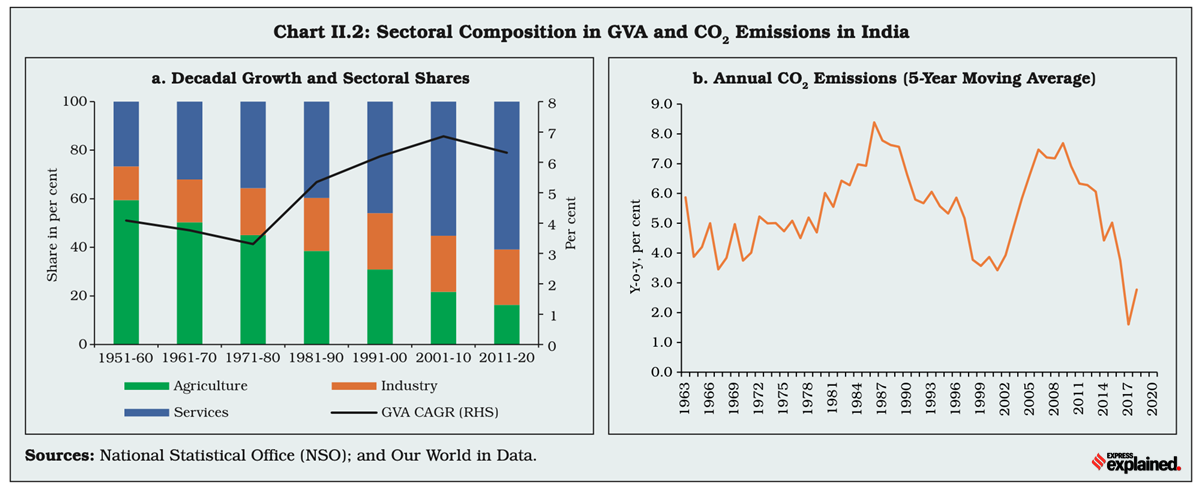 Chart 3: A look at CO2 emissions in India
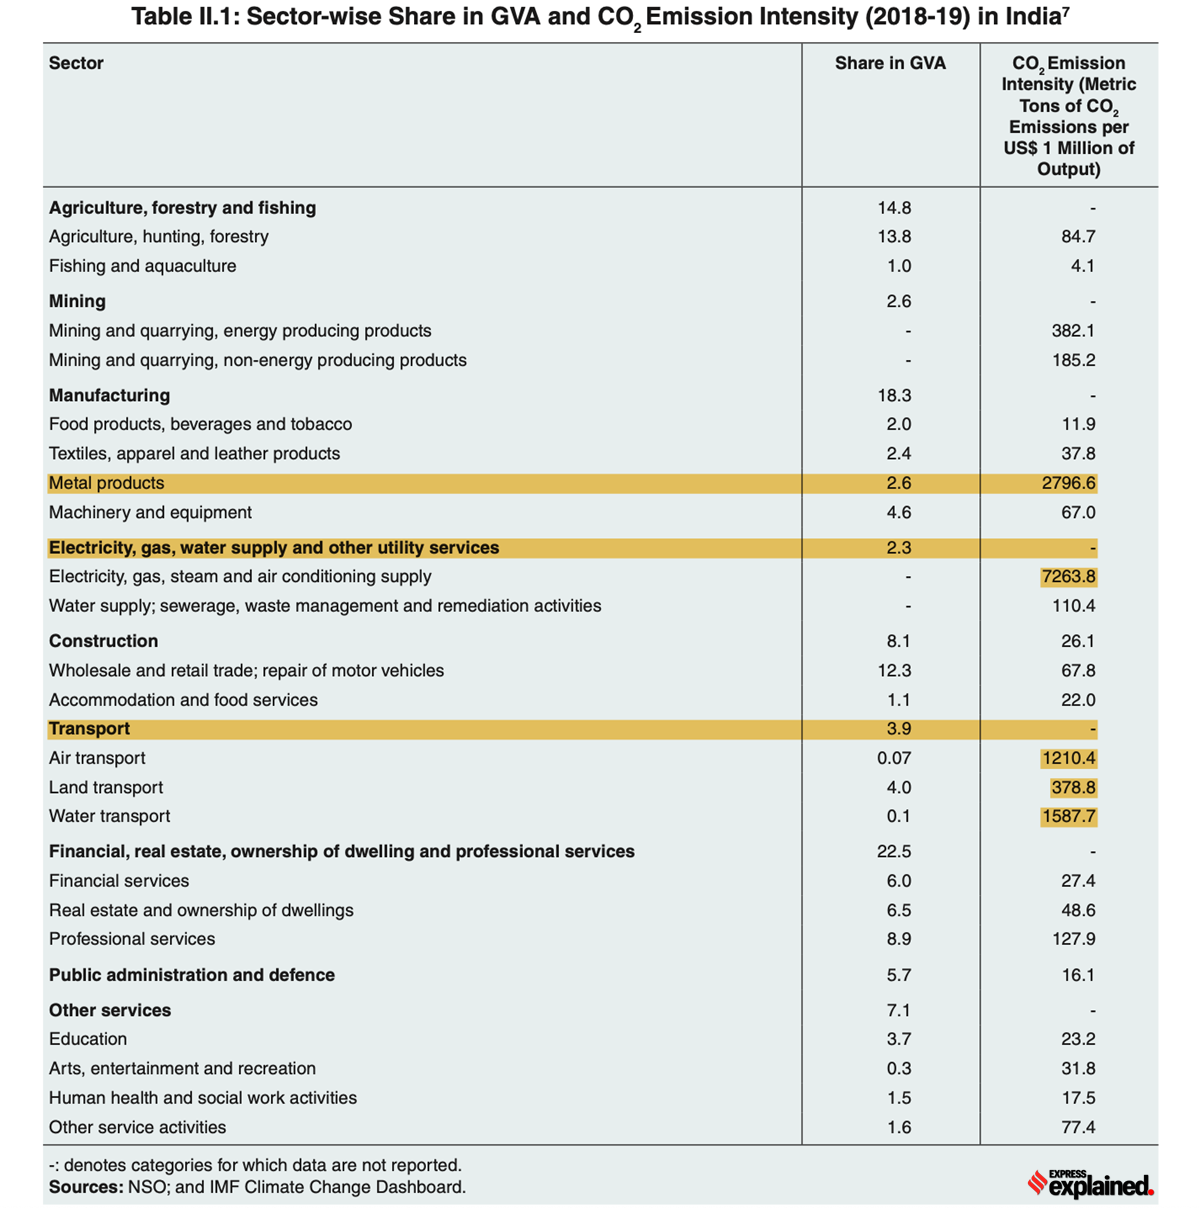 Table 1: Sector-wise share of CO2 emissions in India
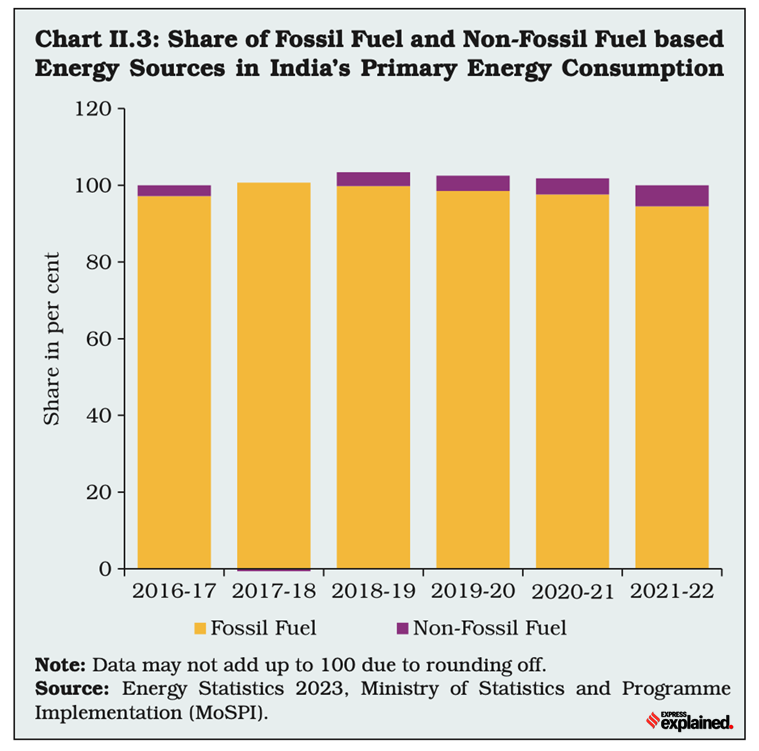 Chart 4: The role of fossil fuels in India’s energy consumption
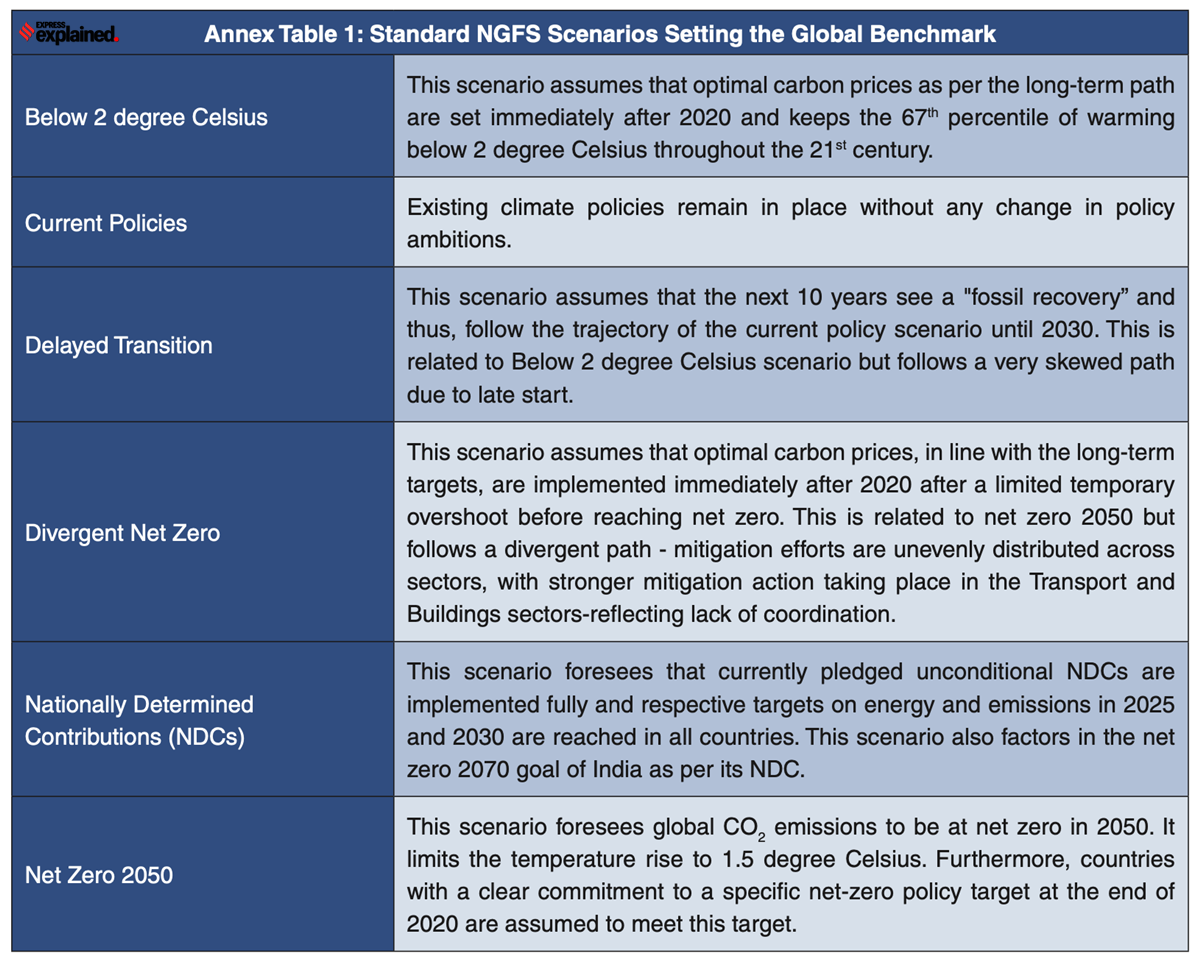 Table 2: NGFS’ standard benchmarks for different scenarios
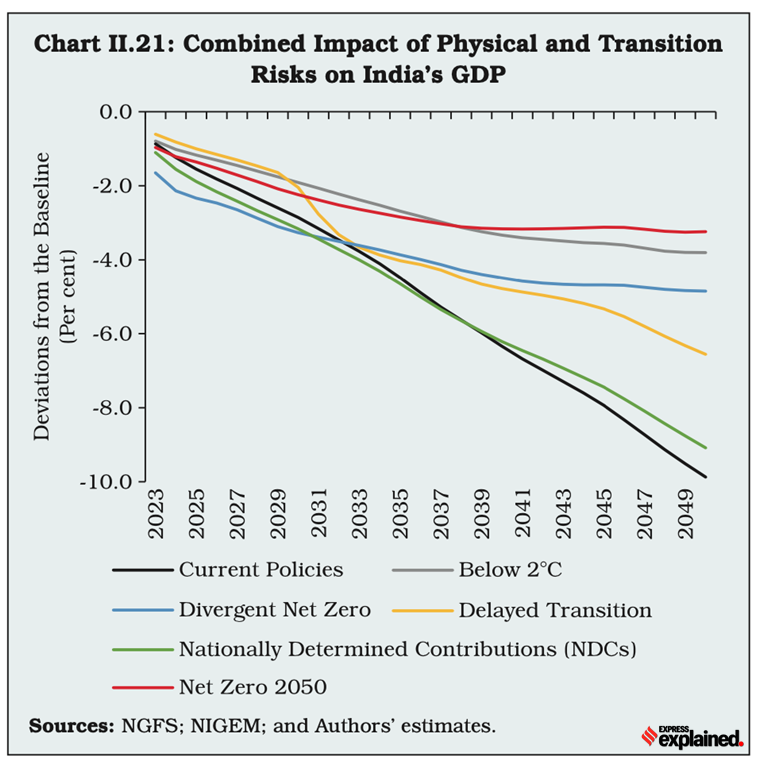 Chart 5: Policy actions have a negative impact on India’s GDP no matter what
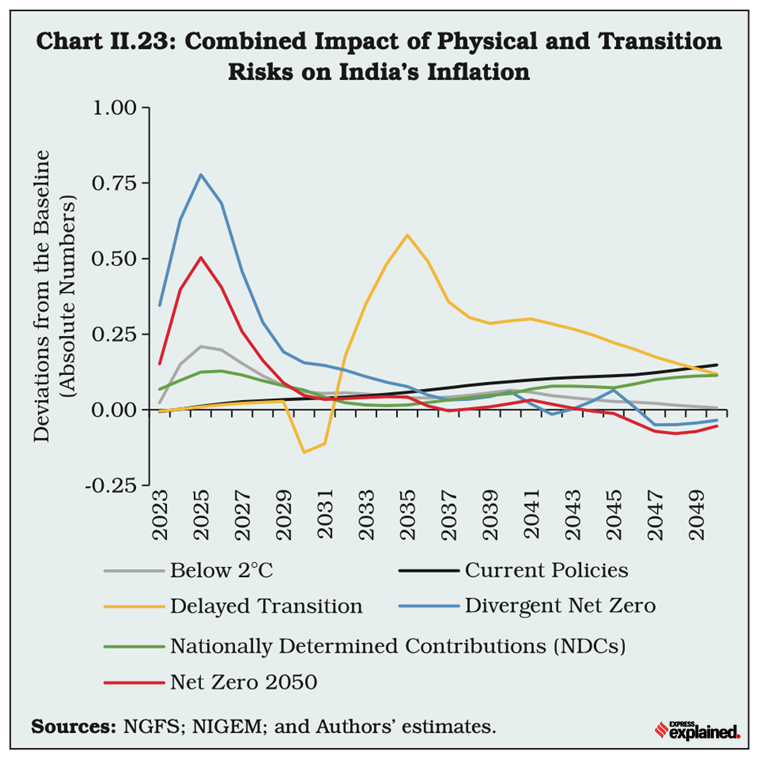 Chart 6: The impact on inflation