Latest Comment
Post Comment
Read Comments

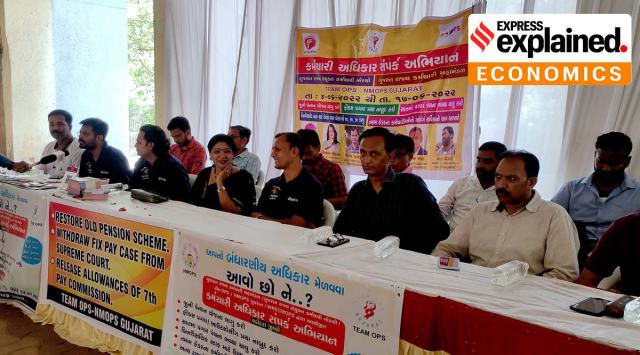 Gujarat Rajya Karmachari Mahamandal protest to retain Old Pension Scheme in 2021. (Express file photo by Bhupendra Rana)
The Reserve Bank of India (RBI) released its latest 2022 Handbook of Statistics on Indian States on Saturday (November 19). What do the data on employees’ pensions say about the ability of (i) states that have switched back to the Old Pension Scheme (OPS), and (ii) states where Assembly polls are currently ongoing, to meet pension commitments out of their own tax revenues?
Rajasthan and Chhattisgarh, which are ruled by the Congress, and Punjab, which is ruled by the Aam Aadmi Party (AAP), have reverted to the OPS. In Himachal Pradesh and Gujarat, where the election process is ongoing, the Congress and AAP have promised a return to the OPS.
***
Himachal Pradesh is the worst off among Indian states. The pensions burden, which consumed almost half the state’s own tax revenues in 2004-05, has ballooned to eat away more than three-fourths of its own tax revenues (OTR)in 2020-21.
To top this, the state’s employee strength has jumped more than 2.5 times to 62,844 in 2018-19 from 25,393 in 2004-05. This shows that the state’s pension bill is unlikely to come down anytime soon. In fact, in some years, it will not generate enough tax revenues to pay even its employees’ pensions entirely.
2004-05: Rs 591 crore
2021-22: Rs 7,082 crore
Increase: 11.98 times
2004-05: Rs 1,252 crore
2021-22: Rs 9,282 crore
Increase: 7.41 times
2004-05: 47.20%
2021-22: 76.29%
2008-09: 25,393
2018-19: 62,844
Increase: 147.48%
***
The state’s pension liabilities have increased over 7 times in the last 16 years. Its tax revenues haven’t increased at a similar pace. Its pension allocation now accounts for almost 30 per cent of its own taxes. With a sharp increase of almost 30 per cent in employee strength between 2008-09 and 2018-19, things will not be smooth for the state in the coming decades.
2004-05: Rs 1,514 crore
2021-22: Rs 11,167 crore
Increase: 7.37 times
2004-05: Rs 6,945 crore
2021-22: Rs 37,434 crore
Increase: 5.39 times
2004-05: 21.79%
2021-22: 29.83%
2008-09: 1,05,101
2018-19: 1,36,154
Increase: 29.54%
***
Rajasthan under Congress rule and Chief Minister Ashok Gehlot was the first state to switch to the OPS. Its pension bill has jumped almost 16 times; and took away 28% of its own tax revenues in 2020-21 compared with just 19% in 2004-05. The state’s employee strength too has jumped 70% between 2008-09 and 2018-19, suggesting an ever-increasing pension bill in the decades to come.
2004-05: Rs 1,626 crore
2021-22: Rs 25,473 crore
Increase: 15.66 times
2004-05: Rs 8,415 crore
2021-22: Rs 90,050 crore
Increase: 10.70 times.
2004-05: 19.32%
2020-21: 28.28%
2008-09: 73,031
2018-19: 1,24,240
Increase: 70.11%
***
Over the last 16 years, Chhattisgarh’s pension bill has jumped over 12 times, but its Own Tax Revenues haven’t increased commensurately. It has risen by just 7.97 times. Hence, pension allocation, which took away 16.5 per cent of its OTR in 2004-05, now takes away 25.66 per cent.
Its employee strength has, however, marginally come down to 40,497 in 2018-19 from 42,895 in 2008-09.
2004-05: Rs 534 crore
2021-22: Rs 6,609 crore
Increase: 12.37 times
2004-05: Rs 3,228 crore
2021-22: Rs 25,750 crore
Increase: 7.97 times.
2004-05: 16.5%
2020-21: 25.66%
2010-11: 42,895
2018-19: 40,497
Decrease: 5.59%
***
The state’s employee strength has jumped by almost 1 lakh persons between 2008-09 and 2018-19. But its OTR growth in the last 16 years has more or less kept pace with rising pension liabilities. Not surprising then, that pension accounts for just 15% of its tax revenues in 2021-22, similar to what it was in 2004-05.
2004-05: Rs 1,892 crore
2021-22: Rs 16,843 crore
Increase: 8.9 times
2004-05: Rs 12,958 crore
2021-22: Rs 1,11,693 crore
Increase: 8.61 times
2004-05: 14.6%
2020-21: 15.07%
2008-09: 2,48,182
2018-19: 4,47,912
Increase: 80.47%