© The Indian Express Pvt Ltd

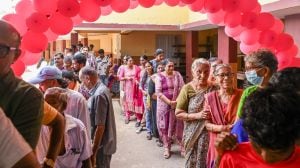
 The poor families who were residing in the low-lying areas alongside the Yamuna River in New Delhi leaving their homes amid floods in July 2023. (Express Photo by Ritvik Gugnani)
 Prime Minister Narendra Modi said in his Independence Day address that in the first five-year term of his government, “13.5 crore of my fellow poor brothers and sisters have broken free from the chains of poverty and entered the new middle class”.
Later in the speech, he said, “When poverty reduces…the power of the middle-class section…increases manifold… Today the 13.5 crore people who have come out of poverty have in a way become the middle class. When the purchasing power of the poor increases, the power of the middle class to carry out business grows too…”
The 13.5-crore number cited by the PM appears in the second National Multidimensional Poverty Index report that was published by Niti Aayog on July 17 (Some highlights in chart). The first such report was published in 2021.
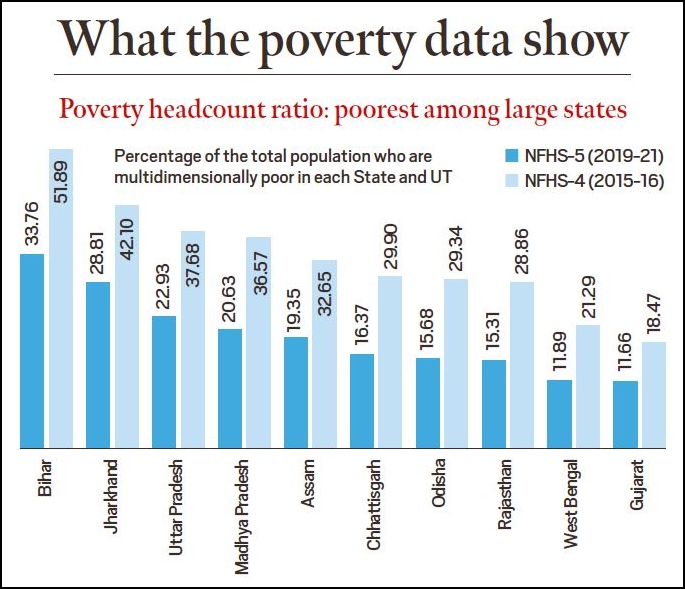
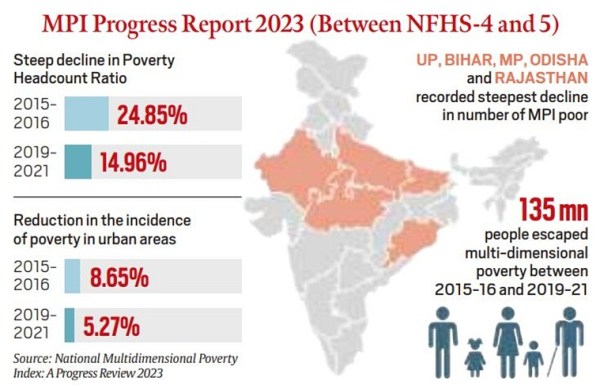
The 2023 edition of the index uses data from the latest round of the National Family Health Survey (2019-21), and captures changes in multidimensional poverty between the survey periods of NFHS-4 (2015-16) and NFHS-5 (2019-21).
The poverty headcount ratio, that is, the proportion of multi-dimensionally poor in the country, fell from around 25% to just under 15% between the two rounds of NFHS. In absolute terms, this implies that 135 million (or 13.5 crore) Indians escaped multidimensional poverty in this period.
The national MPI measures deprivations across the three dimensions of health and nutrition, education, and standard of living.
Within health, it tracks three variables: nutrition, child and adolescent mortality, and maternal health. In education, it tracks two variables: years of schooling, and school attendance. And in standard of living, it tracks seven variables such as sanitation, drinking water, bank account, etc.
The index is based on the methodology used by the Oxford Poverty and Human Development Initiative (OPHI) and United Nations Development Programme (UNDP) to construct the Global MPI. OPHI and UNDP are technical partners in the formulation of the national index.
But India’s MPI is not exactly the same as the Global MPI. For instance, India’s MPI has 12 variables, while the Global MPI has 10. The two additional variables in India’s MPI are maternal health and bank account.
How does this reduction in poverty (13.5 crore in the period between the two NFHS rounds) compare with India’s past record?
It must be noted that this is a multidimensional poverty index and, as such, is not comparable to India’s traditional and official way of estimating poverty.
However, the Global MPI 2023 report, which too was released in July, states that 415 million people in India moved out of poverty between 2005-06 and 2019-21.
Himanshu, an associate professor of economics at Jawaharlal Nehru University, said that 270 million of these 415 million moved out of poverty between 2005-06 and 2015-16, and the remaining thereafter.
The Global MPI pegs India’s poverty ratio at 16.4% as against 14.96% in Niti Aayog’s MPI. This difference is on account of the two additional metrics, and some differences in definitions.
From the time of Dadabhai Naoroji’s 1901 book Poverty and Un-British Rule in India, poverty has been estimated using a monetary measure. The idea has been to arrive at an amount of money that is considered necessary to either eat a subsistence diet (Naoroji’s approach) or to achieve a minimum standard of living.
Since data on income was difficult to collect, India used regular (five-yearly) consumption expenditure surveys (which showed how much people were spending on consumption).
Based on this data, several expert committees — led by D T Lakdawala (1993), Suresh Tendulkar (2009), and C Rangarajan (2014) — drew a “poverty line”. The line is the level of consumption expenditure (stated in rupees) that divides those who are poor from those who are not.
India’s last official poverty statistics are from 2011. The data have not been updated because the government junked the consumption expenditure survey of 2017-18. That survey showed a decline in rural consumption and, as such, pointed to an increase in abject poverty.
Several economists have tried to work around the absence of consumption data — by using NFHS data or data from the think tank Centre for Monitoring Indian Economy (CMIE) — and provided estimates of poverty. But the uncertainty around the data continues to undermine a wide-ranging debate.
Does the reduction in poverty add to India’s middle class?
There is no official definition of the middle class in India. It is, therefore, difficult to say whether those who escape poverty necessarily join the middle class, or to what extent.
Estimates of India’s middle class provided by private research organisations peg the middle class at income levels that are considerably higher than those of the people who are coming out of poverty.
For instance, in a report, ‘The rise of India’s middle class’, published in July, People Research on India’s Consumer Economy (PRICE) divided all households into four categories: Destitutes, Aspirers, Middle Class and Rich. “…Households which are classified as Middle Class have an annual income in the range of Rs 5 lakh to Rs 30 lakh (at 2020-21 prices),” the report said. Destitute households were those with an annual income less than Rs 1.25 lakh.
According to PRICE’s survey, as of 2021, out of a population of 1,416 million, 196 million Indians were categorised as ‘Destitutes’, 432 million were the ‘Middle Class’, and 732 million were ‘Aspirers’.