© The Indian Express Pvt Ltd

 The trend for non-food items over the past decade shows spending was declining for ‘clothing & bedding’, footwear and other taxes, but it has increased in 2023-24 for both rural and urban areas.
In an indication of the impact of rising food prices, the share of spending on food items in the consumption basket of rural and urban households went up in 2023-24, even as non-food items constituted the majority chunk of the spending. Fact sheet of the latest round of the Household Consumption Expenditure Survey 2023-24 released by the Ministry of Statistics and Programme Implementation (MoSPI) on Friday also showed rural spending growing at a faster pace than urban areas, narrowing the gap between the two, and also perhaps signalling a cut in consumption by urban households.
Among states, western, northern and southern states such as Maharashtra, Punjab, Tamil Nadu, Telangana, Kerala, Karnataka, Haryana, Gujarat, Andhra Pradesh fared better with per capita monthly consumption spending higher than national average, while lower spending was recorded by eastern and central states of India such as West Bengal, Bihar, Assam, Odisha, Uttar Pradesh, Madhya Pradesh, Jharkhand, Chhattisgarh. Key trends from the latest consumption survey are:
Overall consumption spending
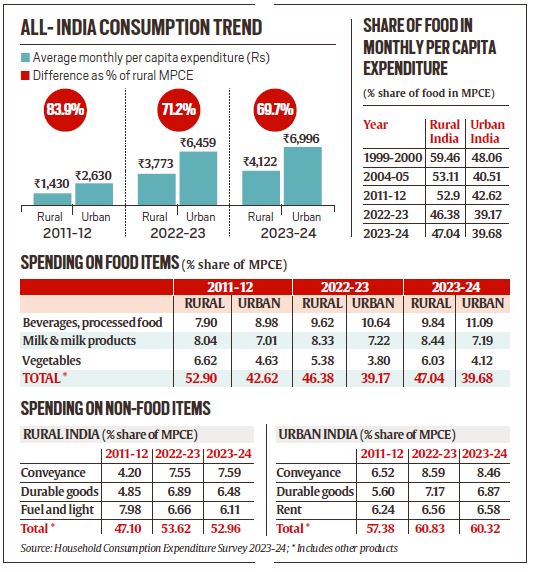
Rural average monthly consumption spending per person increased to Rs 4,122 in 2023-24, an increase of 9.3 per cent from Rs 3,773 in 2022-23. It had stood at Rs 1,430 in 2011-12. This increase in rural spending over the one-year period was higher than the urban average monthly consumption expenditure per person at Rs 6,996 which increased by 8.3 per cent from Rs 6,459 in 2022-23. The urban average monthly per capita consumption expenditure (MPCE) stood at Rs 2,630 per person in 2011-12.
The difference in average monthly consumption expenditure between rural and urban households narrowed further to 69.7 per cent in 2023-24 from 71.2 per cent in 2022-23, and 83.9 per cent 11 years ago in 2011-12.
 All-India Consumption Trend.
This seems to suggest that the pace of spending is higher in rural India compared with the urban population, which seems to be cutting down on its consumption. It could also be reflective of a decline in income levels or slower pace of income growth and hence, a reduction in consumption levels.
Spending on food and non-food items
Reversing a trend of decreasing share of spending on food, the share of spending on food in the monthly consumption basket for a person in rural as well as urban areas went up in 2023-24. The average monthly per capita expenditure (MPCE) or the spending by a person on an average, for food increased to 47.04 per cent in 2023-24 from 46.38 per cent in 2022-23. For urban households, the spending on food inched higher to 39.68 per cent in 2023-24 from 39.17 per cent in the previous year.
In the previous year 2022-23, it was the first time in over two decades that the share of spending on food for a person in rural areas had slipped below 50 per cent of his or her total consumption spending in a month. Similarly, for urban areas, spending on food had seen a declining trend from 48.06 per cent in 1999-2000 to 42.62 per cent in 2011-12 and 39.17 per cent in 2022-23.
In absolute terms, the average monthly spending on food by a person in a rural household was Rs 1,939, while that in urban areas was Rs 2,776. For non-food items, a person in rural areas is estimated to have spent Rs 2,183 in a month, while the spending by a person in urban areas was Rs 4,220.
What food items did people spend on?
Like 2022-23, the highest spending among food items as a share of the total MPCE was on ‘beverages, refreshments, processed food’ in both rural and urban areas in 2023-24. While the rural population spent 11.09 per cent of their total MPCE on ‘beverages, refreshments, processed food’, the share of urban areas stood at 9.84 per cent. This was followed by spending on ‘milk and milk products’, with a person in rural household spending 8.44 per cent of their total monthly expenditure on it, and a person in an urban area spending 7.19 per cent on it.
The third spot was taken by vegetables in both rural (6.03 per cent) and urban (4.12 per cent) areas. After this, while rural areas spent a higher share on cereals (4.99 per cent), urban areas saw higher spending on fruits (3.87 per cent). At the fifth place was ‘egg, fish & meat’ for rural areas (4.92 per cent), and ‘cereals & cereal substitutes’ in urban areas (3.76 per cent).
When compared to earlier years of 2011-12 and 2022-23, a few food items showed an interesting trend. For instance, spending on sugar and salt has shown a decreasing spending trend in both rural and urban areas over the years, while ‘beverages, processed food’ has shown an increasing trend in spending across the country. Spending on ‘egg, fish & meat’ and edible oil has also shown a consistent declining trend in monthly spending for urban households over the past decade.
Spending on vegetables, spices, pulses was showing a decline for both rural and urban areas earlier but it has increased in 2023-24. Spending on fresh fruits has increased in rural areas over the years, while in urban areas, spending on milk and milk products had increased in 2022-23 but reduced in 2023-24.
What non-food items did people spend on?
For non-food items, the share of expenditure stood at 52.96 per cent and 60.32 per cent in rural and urban households, respectively, in 2023-24 as against 53.62 per cent and 60.83 per cent in 2022-23. In rural India, consumption expenditure on non-food items was driven by conveyance (7.59 per cent); medical (6.83 per cent); clothing, bedding & footwear (6.63 per cent); durable goods (6.48 per cent); and miscellaneous goods and entertainment (6.22 per cent). In urban India, the spending on non-food items was mainly on account of conveyance (8.46 per cent); miscellaneous goods and entertainment (6.92 per cent); durable goods (6.87 per cent); rent (6.58 per cent); and education (5.97 per cent).
The trend for non-food items over the past decade shows spending was declining for ‘clothing & bedding’, footwear and other taxes, but it has increased in 2023-24 for both rural and urban areas. In rural areas, there has been a reversal in trend for spending on medical (hospitalisation and non-hospitalisation), entertainment, rent and durable goods, which had increased earlier between 2011-12 and 2022-23 but now has decreased in 2023-24. In urban areas, the spending on medical (hospitalisation) and education was decreasing earlier but it has now inched higher in 2023-24, while spending on rent has increased over the past decade. The share of spending on rent in urban areas was 6.58 per cent in 2023-24, higher than 6.56 per cent in 2022-23 and 6.24 per cent in 2011-12.
What was the consumption pattern as per the fractile classes of expenditure?
A closer look at the fractile data reveals that the top 5 per cent of the rural and urban population saw a decrease in consumption spending in 2023-24, even as all other segments of the population, including the bottom 5 per cent, registered an increase. The average MPCE has increased the most (22 per cent) from the level of 2022-23 for the bottom 5 per cent of India’s rural population, while for bottom 5 per cent of the urban population, there has been a growth of 19 per cent during the same period.
The monthly per capita expenditure (MPCE) of the top 5 per cent of the rural and urban population stood at Rs 10,137 and Rs 20,310, respectively, in 2023-24 lower than Rs 10,501 and Rs 20,824 in 2022-23. The MPCE of bottom 5 per cent for rural and urban population increased to Rs 1,677 and Rs 2,376, respectively, in 2023-24 from Rs 1,373 and Rs 2,001 in 2022-23.
The increase in average monthly per person spending in percentage terms was the highest in 2023-24 for bottom 20 per cent in rural and urban areas at Rs 6,276 (19.2 per cent increase from 2022-23) and Rs 9,156 (18 per cent increase), respectively. Top 20 per cent saw an increase in monthly spending of just 1.5 per cent to Rs 22,829 for rural areas and 1.1 per cent rise to Rs 43,266 for urban areas.
Experts pointed out that this is in contrast to evidence from other datasets that show a rise in spending by the top segment, especially on premium goods. “Every fractile class has shown an increase in consumption except the top fractiles which is opposite to the trend being seen in other datasets,” an economist, who did not wish to be named, said.
The deviant trend in the top fractiles may also be a result of the change in methodology, Former Chief Statistician of India Pronab Sen said. “The household consumption surveys were earlier done once every five years but after the change in methodology, the back-to-back surveys were conducted to see if the revised methodology is stable. The change in methodology needs to be validated, otherwise it may show results which are not explainable,” he said. Also, it’s possible that while conducting the survey, the respondent is not the same during subsequent visits and it is not the same category of people from whom they are getting responses, he said.
Which states fared better in terms of consumption spending?
Among the states, the highest monthly per capita expenditure in 2023-24 was recorded in Sikkim (rural – Rs 9,377 and urban – Rs 13,927). It was the lowest in Chhattisgarh (rural – Rs 2,739 and urban – Rs 4,927). Among the union territories, MPCE is the highest in Chandigarh (rural – Rs 8,857 and urban – Rs 13,425), whereas it is the lowest in Dadra and Nagar Haveli and Daman and Diu (Rs 4,311) and Jammu & Kashmir (Rs 6,327) in rural and urban areas, respectively.
The rural-urban difference in average MPCE among the states was the highest for Meghalaya (104 per cent) followed by Jharkhand (83 per cent) and Chhattisgarh (80 per cent). In 8 out of 18 major states — Maharashtra, Punjab, Tamil Nadu, Telangana, Kerala, Karnataka, Haryana, Gujarat, Andhra Pradesh — average monthly per capita expenditure was higher than the all-India average MPCE in both rural and urban areas.
State-wise data also showed a divergent trend between consumption patterns of high spending by western, northern and southern states and lower spending by eastern and central states of India. For instance, the average spending per person was lower than the national average in rural and urban areas of West Bengal, Bihar, Assam, Odisha, Uttar Pradesh, Madhya Pradesh, Jharkhand, Chhattisgarh in 2023-24. States of Maharashtra, Punjab, Tamil Nadu, Telangana, Kerala, Karnataka, Haryana, Gujarat, Andhra Pradesh showed per capita spending higher than the national average.
Rajasthan and Gujarat stood out as they showed different pattern for consumption spending in rural and urban areas. Rajasthan registered spending lower than national average for urban areas but a higher-than-national average spending for rural areas, while Gujarat recorded lower-than-national average spending in rural areas, and higher-than-national spending in urban areas.