© The Indian Express Pvt Ltd

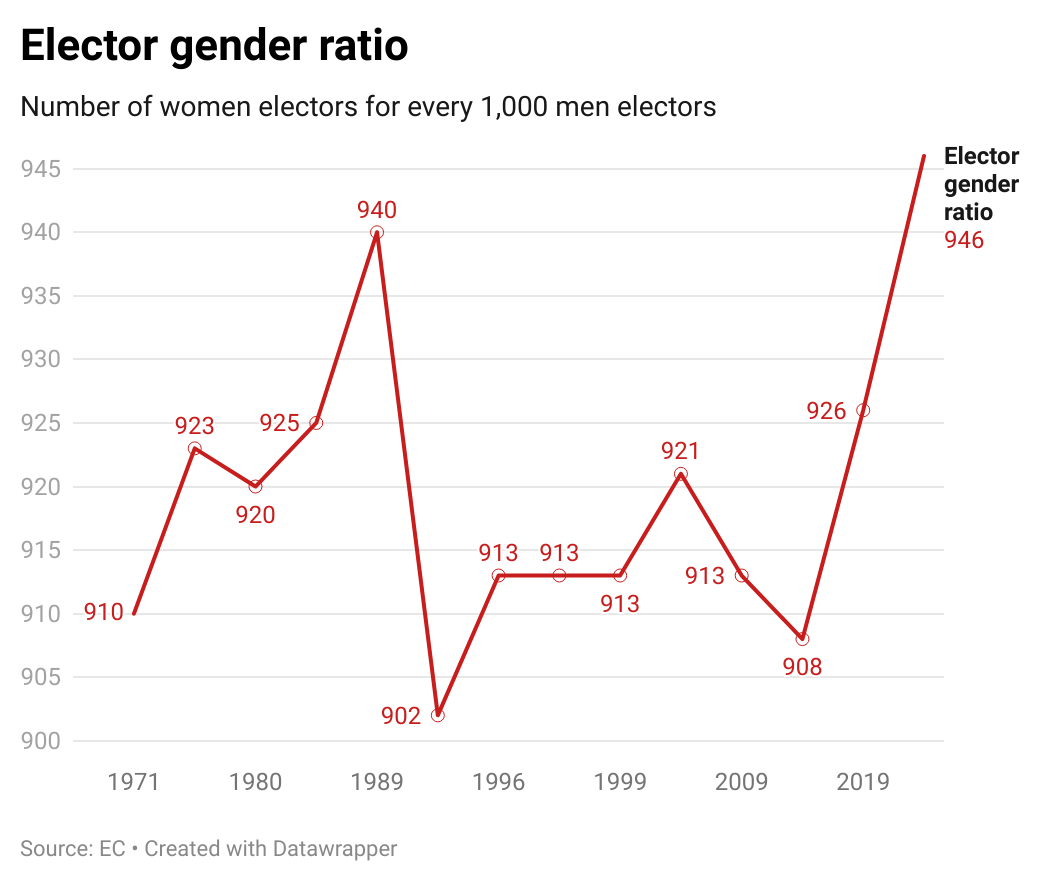
 Since 1971, the gender ratio for electors, that is the number of women electors for every 1,000 men electors, has increased from 910 to 946 in 2024. (File Photo)
Nine months after the 2024 Lok Sabha elections wrapped up, the Election Commission (EC) on Wednesday released its ‘Atlas’ for the polls, providing statistics and analysis of the largest electoral exercise in the world so far. The elections saw the highest number of electors so far at 97.98 crore, of whom 64.21 crore voted for a turnout of 66.1%.
1. Women’s participation
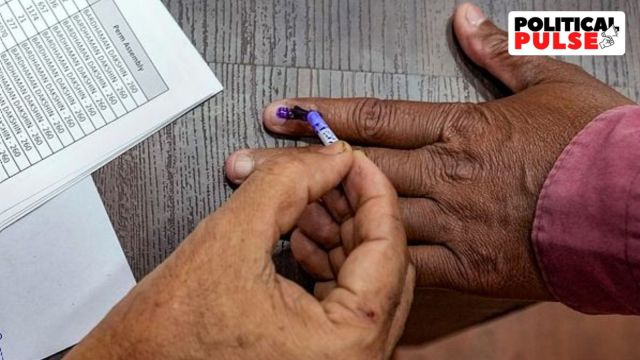
While the voter turnout among women was slightly higher than men, at 65.78% versus 65.55%, there is still a big gap between women and men electors who are registered to vote.
Since 1971, the gender ratio for electors, that is the number of women electors for every 1,000 men electors, has increased from 910 to 946 in 2024. After falling from 2009 to 2014, the gender ratio has increased in the past two Lok Sabha elections from 908 in 2014 to 926 in 2019, and 946 in 2024. As per the 2011 Census, the sex ratio in the country was 943 females to 1,000 males.
 Electors gender ratio
2. Age groups
Overall, young electors aged between 18 and 29 years accounted for 22.78% of the total electors in the country. These electors accounted for over one-third of the total electorate in Dadra and Nagar Haveli and Daman and Diu (38.8%), Meghalaya (36.01%) and Arunachal Pradesh (34.12%). Kerala had the lowest percentage of electors aged 18 to 29 at just 18.04%, followed by Delhi at 18.89%.
 Top 5 states/UTs by share of electors aged 18-29
Electors aged between 30-59 years accounted for 60.63% of the national electorate. Delhi had the highest percentage of electors in this age group, at 65.99% of its total electors. Kerala had the highest percentage of senior citizen electors (20.46% were in the 60 to 79 year age cohort).
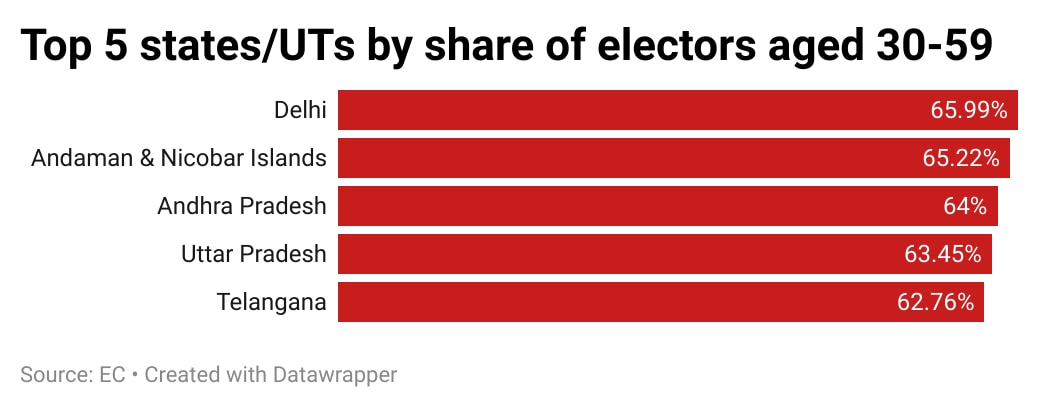 Top 5 states/UTs by share of electors aged 30-59
3. Participation of parties
Over the 18 general elections so far, the total number of candidates and parties in the fray has grown. Since the first general election in 1951-52, the percentage of candidates belonging to national parties has come down drastically, while those contesting as Independents and on tickets of Registered Unrecognised Political Parties (RUPPs) has gone up.
In 1951-52, the national parties dominated the elections, with nearly 65% of all candidates belonging to 14 national parties. In 2024, candidates of national parties accounted for only 16% of the total 8,360 candidates in the fray. On the other hand, candidates who fought as Independents went from 28% in 1951-52 to 39% in 2024. Candidates from RUPPs went from zero in the first elections to 32% of all candidates in the fray in 2024.
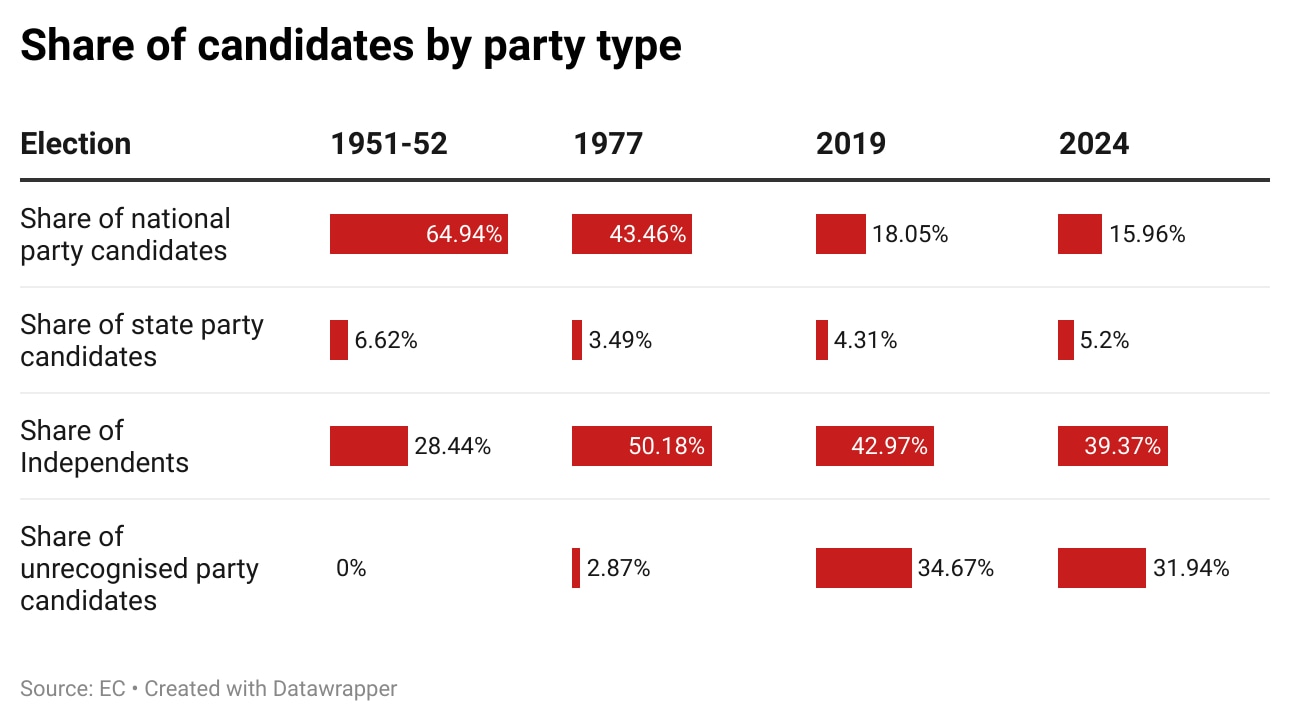 Share of candidates by party type
4. Forfeited deposits
The 2024 Lok Sabha elections saw 86% of the total candidates forfeit their deposits as a result of failing to secure at least one-sixth of the total valid votes polled in their respective constituencies. The percentage of candidates who lost their deposits was the highest since 1996, when 91% of candidates forfeited deposits. The first three general elections saw less than 50% of candidates forfeit their deposits. Since the 1967 elections, the percentage of candidates who lost their deposits has been more than 50%.
 Forfeited deposits
5. Expenditure by candidates
The total election expenditure declared by candidates, which is capped at between Rs 75 lakh and Rs 95 lakh depending on the size of the state, was Rs 862.68 crore. The average expenditure declared by winning candidates was Rs 57.23 lakh, with the highest being declared by the Congress’s Thiruvananthapuram MP Shashi Tharoor at Rs 94.89 lakh.
 Seats with the highest total expenditure
The five constituencies with the highest total expenditure declared by candidates were all in Punjab – Faridkot, Anandpur Sahib, Sangrur, Bathinda and Patiala – where the expenditure ranged from Rs 3.54 crore to Rs 419 crore, amounting to an expenditure of Rs 30.79 per voter in Patiala to Rs 41.4 per voter in Faridkot.
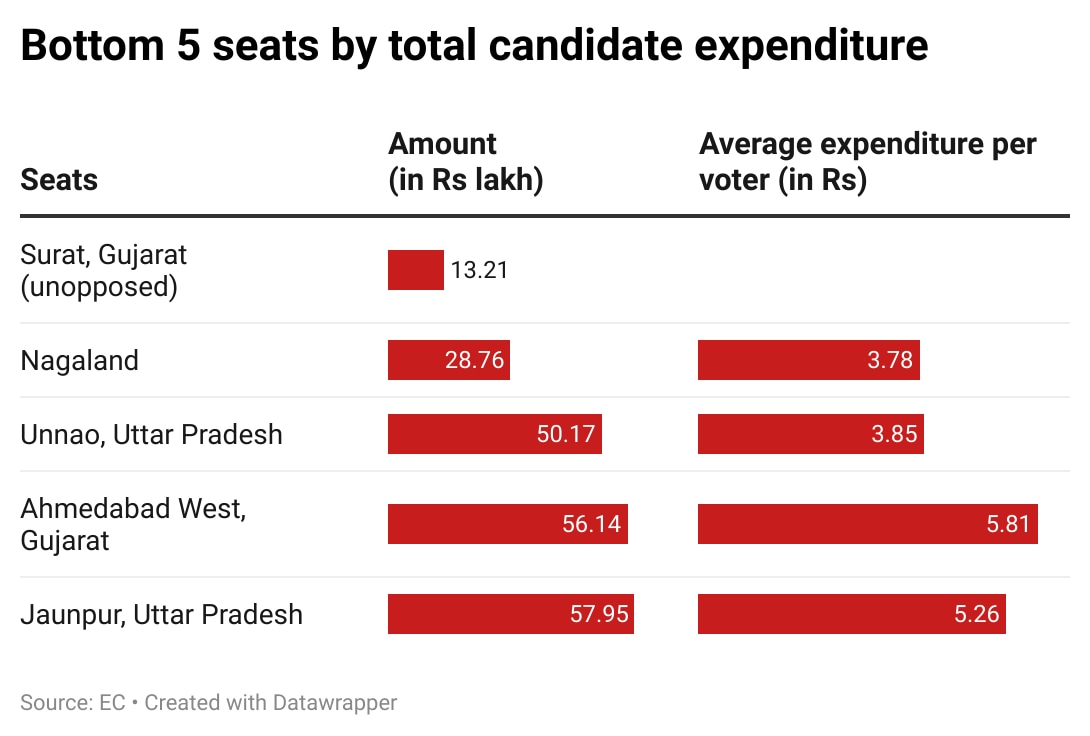 Seats with the lowest total expenditure
Surat, which was uncontested, had the lowest declared expenditure of any constituency, followed by Nagaland, where candidates spent an average of Rs.3.78 per voter.