© The Indian Express Pvt Ltd

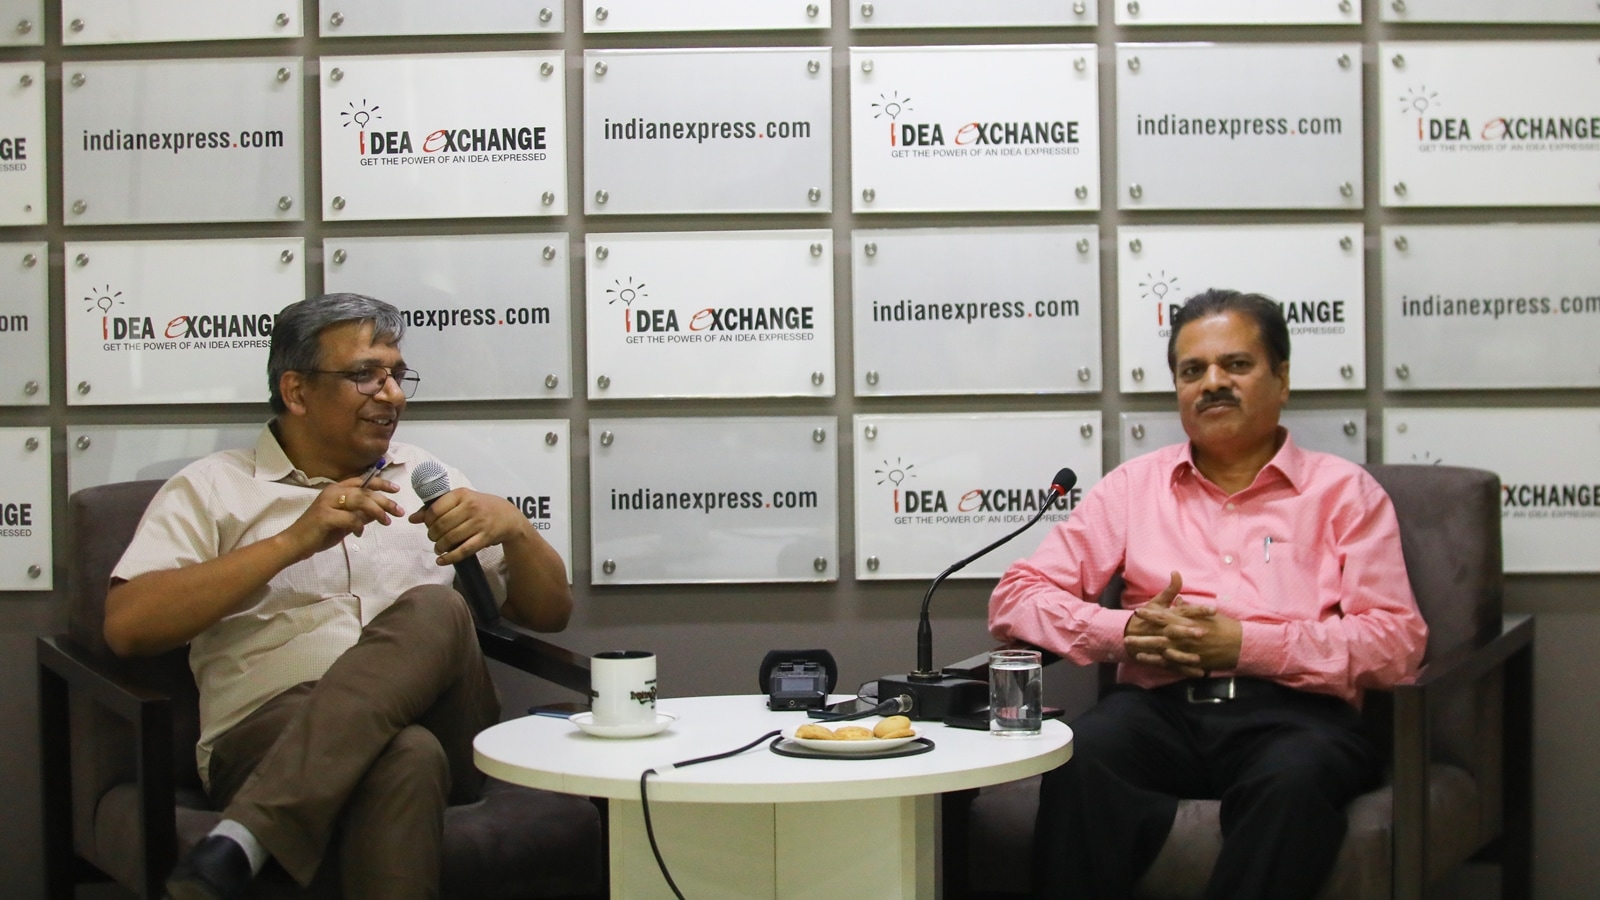 Dr Mrutyunjay Mohapatra (right) with Amitabh Sinha at the Indian Express office in Noida. (Express Photo by Abhinav Saha)
Dr Mrutyunjay Mohapatra, Director-General of Meteorology, IMD, on 50°C plus temperatures, the efficacy of forecasts and detection mechanisms and impact of climate change on rainfall. The session was moderated by Science Editor Amitabh Sinha
This has been the longest spell because it has been experienced for about 24 days in different parts of the country. In April, the heatwave condition was most intense and prevalent over the eastern and southern parts of India.
In May, it shifted to the core region, that is, northwest and central India, while it persisted over the eastern parts of the country. Up to May 15, there was regular rainfall activity due to passage of western disturbances and thunderstorms.
From May 16, heatwave conditions started over west Rajasthan and spread, becoming more intense over the eastern parts. If you count the number of days, it was most intense over Rajasthan and Odisha. In April, the spell was longer in the eastern part of the country.
You can say that the heatwave was more durable in both these months. But it is decreasing as the monsoon is slowly covering the peninsula and expected to touch south Gujarat by June 12. We are expecting the monsoon to hit northwest India as usual, by the last week of June.
The day a station recorded 52.9°C, we immediately cross-checked with 17 other stations in Delhi and found that it was an outlier. None of these stations had reported temperatures higher than 49°C. We constituted an expert committee, which observed readings for the next two days and found there were problems in the sensor. We compared parallel readings by our departmental observatory, which has five such stations. We found no such difference there either. Then, after two days or so, a station in Nagpur, too, reported 56°C. Sensors contain semiconductors. So their functioning depends upon the temperature and resistance of semiconductors. Resistance varies with temperature. Therefore, we have to investigate whether an erroneous reading is because of higher temperatures or a malfunctioning sensor.
ON ACCURACY OF FORECASTS: We have 1,500 sensors but one faulty reading doesn’t mean all are malfunctioning. We have checked them, especially those in northwest India, where temperatures are higher. Only one sensor was found to be faulty
We have 1,500 sensors but it doesn’t mean all of them are malfunctioning. We investigated and decided that all instruments, especially in northwest India, where temperatures are higher, would be checked. So far, only one sensor has been found to be faulty, which we have replaced. Also, we do not enter one or two odd observations into our records.
Every 15 minutes, the temperatures taken by the AWS are updated on the website automatically. If there is a continuous bias, because of sensor malfunctioning at higher temperatures, then bias correction can be made. We inspect the AWS every six months. But in between a bird or a monkey can disturb it. Another source of error is the radiation shield. If a shield gets heated and is trapping energy, the sensors may record a different reading. AWS is utilised globally and such errors are common.
The country has progressed in terms of meteorological observations, monitoring and forecasting. By the way, we have a seamless forecast for heatwave conditions. As soon as the season starts, we do monthly, weekly and daily forecasts. During heatwave conditions, we provide two readings, one for the morning and the other for warm nights. Warm nights are when the day temperature is above 40°C and the night temperature is about five degrees above normal. We predict warm nights for about five to seven days, both city-wise and district-wise, so that people can get a sense of what the impact will be. The 40°C temperature in Delhi and Bhubaneswar will have different impacts. Delhi has dry heat, Bhubaneswar has humidity between 50 per cent and 70 per cent. With higher humidity, the sweat factor goes up and the same 40°C temperature will feel like 45-47°C. That’s why we have introduced the temperature humidity index on a weekly basis for the last two years so that you get an idea about what a “feels-like” temperature could be.

A heatwave is dry with stagnant air. Loo is when you have strong north-westerly winds. A land breeze enhances the impact of a heatwave. Similarly, wind in the coastal belt, what we call sea breeze, reduces the impact of the heatwave. Our wind forecast helps you gauge physical conditions. Then we have a composite index, which factors in the maximum and minimum temperatures, humidity, wind and heat persistence, the kind of consistently high temperatures we saw in the last week of May.
We forecast daily weather in a colour-coded format and have introduced dos and don’ts, not only for human beings but also for livestock. A heatwave entails huge economic loss in terms of its impact on agriculture and the power sector. A predictive temperature map can help power companies plan their load distribution better and avoid power cuts. Similarly, if you are travelling by train, the water and AC requirement in the coach will increase during heatwave conditions. The new forecast parameters can, therefore, help surface transport operators like national highways and the railways. For example, we colour-coded each railway station, red and orange, indicating the severity of heat and indicating the responsive action to be taken. Similarly, we provided forecasts for each constituency in each phase of the election five days ahead of voting day. All this information is easily available to common people on a geographic information system (GIS) platform. A common alert protocol has been developed with the help of the National Distribution Authority and state governments. So the moment we identify an area where a heatwave is expected, an SMS goes to mobile users within that area.
Human activities, increasing population, industrialisation and transport mechanisms are leading to increased concentration of carbon dioxide, methane or chlorocarbons. Globally, temperatures have gone up by 1.15 degrees in the past 100 years. In India, it is 0.66 degrees over the same period. This increase is also not uniform across the globe or India. In the polar region, it is higher, in the equatorial region, it is lesser. Northern India is getting more intense and southern India is getting less intense. In India, the maximum temperature has risen by about 1.1 degrees, the minimum by 0.28 degrees. Therefore, the average is 0.66 degrees.
ON MICROCLIMATE MODELS: We have different forecasts for different parts of the city. Under the ‘Har Har Mausam, Har Ghar Mausam’ model, you get the weather forecast specific to whichever location you are at
Once these gases are transmitted to the atmosphere, they will not degrade on their own. So, the temperature will continue to rise. Second, if we continue our radiative concentration pathways and release our radiative energy into the atmosphere, then there will be an accelerated increase in all greenhouse gases that could raise temperatures. Therefore, we are endangering not only ourselves but also our future generations. Also, with a one-degree rise in temperature, the relative humidity in the atmosphere increases by seven per cent. So heatwaves will be more frequent, durable and intense, if precautionary or preventive measures are not taken.
The El Nino had a stronger effect on the monsoon last year and played a role in frequent and intense heatwave conditions this year. But you cannot overlook the development of anticyclones — when wind rotates in a clockwise direction at about 3 to 5 km above the earth — in the peninsular region. That means the wind has to go down. Once air moves towards the surface of the Earth, it gets compressed because it cannot penetrate the surface. This warms it up. That’s why the temperature rose in the background of El Nino conditions.
Without western disturbance, the temperature rose in northwest India. At the same time, there wasn’t any anticyclone over the Bay of Bengal, which could provide moisture. So in May, there was no thunderstorm activity in the eastern part of the country, which experienced very intense heatwave conditions.
The Central Water Commission has been given the responsibility of glacial lakes because IMD is not the nodal agency for that purpose. So our ambit is to provide 40 location-specific forecasts for hydropower and flash flood guidance for watershed areas. When we talk about glacial lakes, there are geological parameters other than the weather like earthquakes, geological dislocation of various hills and avalanches. This requires a multi-modal approach by all agencies.
ON THE TECH EDGE: The country has progressed in terms of meteorological observations, monitoring and forecasting. We now predict a ‘feels-like’ temperature, warm nights and wind patterns
When I took over, we decided to factor in the microclimate in major cities. We now have different forecasts for different parts of the city. For example, in Delhi, we provide forecasts for 18 places. This year we’ve introduced a model called “Har Har Mausam, Har Ghar Mausam.” This means that you will get the weather forecast specific to whichever location you click on our dashboard. In Mumbai, we’ve got around 120 automatic rain gauge stations (ARGs), 32 in Delhi. We are augmenting observation systems in every city and will be upgrading radars. Megacities will get expanded radars. Delhi has got three such radars, one each in Palam, Lodi Road and Aya Nagar. The Aya Nagar radar covers 100 km. Chennai will get four radars, Kolkata will get another one. If one radar fails, another one is there for specific information.
At present, we have got a global model with a resolution of about 12 km. That means every 12 km you will get a forecast. Since that won’t be sufficient for a city, we’ve introduced a 2-km model. We will improve the resolution further because we are in the process of procuring a high-performance computing system. Then we can move to the one kilometre and sub-kilometre domain to provide forecasts in a location-specific manner within the city itself. This model can help preparedness in disaster-prone areas like the Himalayas and areas vulnerable to cloudbursts and flash floods. We now have 10 expanded radars in the northeastern Himalayas. The plains will get another 11. By 2025, at least another 25 radars will be added.
A cloudburst is a very small scale phenomenon. It occurs over a radius of 1 km or so and lasts one or two hours at the most. If the rainfall exceeds 10 cm in one hour, we call it a cloudburst. We have mapped areas most prone to cloudbursts — Jammu and Kashmir, Himachal Pradesh, Uttarakhand, Northeastern states and Western Ghats. Sometimes cloudbursts happen in plain areas because of a low pressure system. We need many radar systems in our hilly areas. But you also need electricity and telecommunications to use the data on a real-time basis. With augmented technology, we are trying to improve our observation systems in the hills. From the current 85 per cent of covered area, we hope to cover 100 per cent in the next two years.
Once the detection mechanism is right, we can look at predictions. I already mentioned the sub-kilometre resolution model. Our regional model will be updated from three kilometres to one kilometre in about three years. Then we can predict not just the cloudburst but the rainfall intensity as well. We are now tracking mini cloudbursts that cause five-centimetre rainfall with experts at IIT Mumbai and other scientists.
Sophya Mathew: Last year Delhi faced severe flooding during the monsoon. Can the city prepare better with warnings?
Any planning involves early warning, preparedness, prevention and mitigation. I can talk about early warning, where I look at historical data to know about hazard and vulnerability. So if heavy rain is predicted in Delhi, data shows us that Minto Road will get flooded. Now people should be made aware of how to use this information while stepping out.
We also have Nowcast, which is being provided for different parts of the city. For the long-term, we are planning three more extended radars in the outskirts of Delhi so that the entire NCR region can be alerted.
Climate change has three aspects — One is science, the other is adaptation, third is mitigation. IMD is responsible for the science or detection of climate change. Every January, we make an annual climate statement based on temperature and rainfall patterns of the previous year and compare that to the past 100 years. Every change is not climate change. There are other factors like increase in carbon dioxide or methane levels that have to be considered.
You need attribution science, which is about understanding the role of climate change versus natural weather patterns and climate variability. There is limited progress here. For this, there should be sufficient monitoring of carbon dioxide, methane and other greenhouse gases in different parts of the country. There should be a regional climate assessment. Certain states have set up a climate change cell and are working with IMD.
We have to track bipolar patterns too. For example, we find that the total rainfall of the country is not changing but the distribution of rainfall is changing. Western Rajasthan, which is usually a drought-prone area, is now experiencing rainfall. In the Northeastern states, Jharkhand and Bihar, rainfall is decreasing. Within the season itself, the rainfall is not uniformly distributed. That means the frequency of heavy rainfall has increased but the frequency of light rain or moderate rain has decreased. The frequency of thunderstorms is increasing.
Now a thunderstorm requires four parameters — intensity, humidity, an unstable atmosphere and a triggering mechanism like western disturbance or low pressure. Out of four, even if three conditions are favourable, the frequency of thunderstorms will go up. Also, the temperature is not rising everywhere in the atmosphere. It is rising in the lower troposphere, up to a height of three kilometres. If you go to the middle troposphere level of five to six kilometres, the temperature starts falling. And this prediction was made by the Nobel-winning climatologist and meteorologist from Japan, Syukuro Manabe. More thunderstorms are happening because of this temperature difference.
For the occurrence of cyclone, we should have higher temperature and humidity in the middle troposphere. If the temperature is falling here, then humidity will be less and cyclones cannot be generated. So, both the genesis and frequency of cyclones are decreasing. But once genesis takes place, the heat energy transfer increases because of an unstable atmosphere. Therefore, the intensity of cyclones is increasing. Over the Arabian Sea, the intensity of cyclones has been increasing from 1990 onwards.
By the beginning of August, La Nina conditions (when ocean surface temperatures cool down) are expected to set in. Once that happens, there will be higher rainfall in the second half of the season and you can expect rainfall in August. But rainfall will remain dependent on low pressure systems. Last year, there was no low pressure system in August. It developed in June, July and September. July rain is very important in terms of agriculture because it is the sowing month. Crops can survive.