© The Indian Express Pvt Ltd

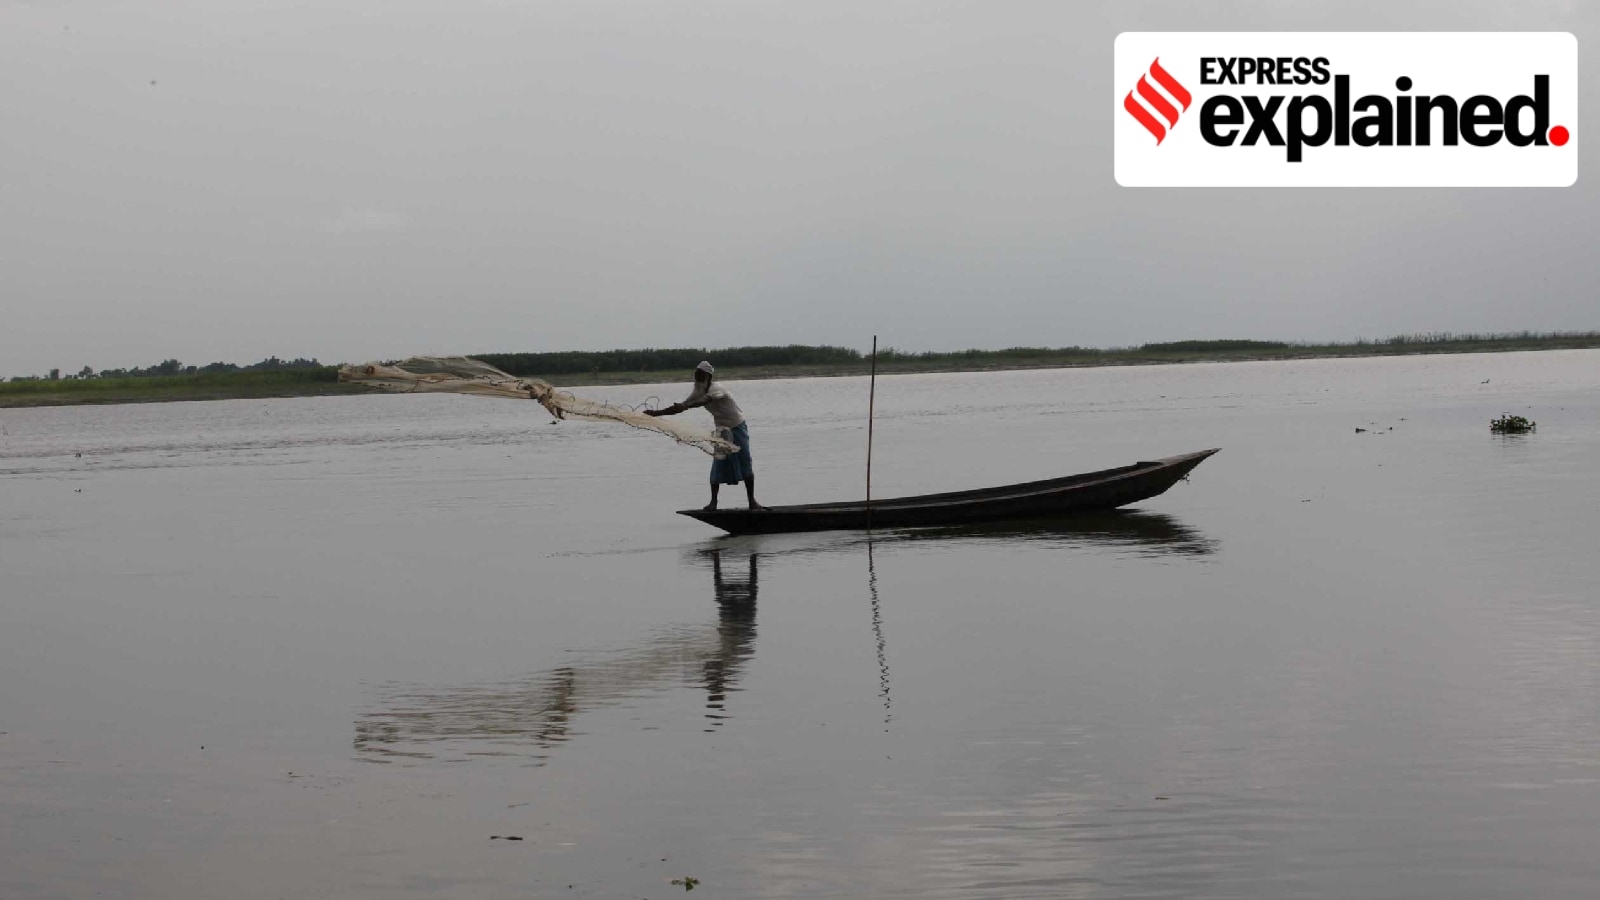 A fisherman fishing in the Brahmaputra river. (Express Photo by Subham Dutta)
The Central Water Commission (CWC) in its study titled ‘Assessment of Water Resources of India 2024’ estimated that India’s average annual water availability, between 1985 and 2023, stood at 2,115.95 billion cubic meters (BCM).
Here is how the CWC arrived at this number, and what this means.
What is the CWC’s water availability figure based on?
In its study, the CWC assessed the average annual water availability based annual net-runoff using precipitation, evapotranspiration, land use, land cover, and soil datasets as major inputs. The water availability has been assessed for all river basins in the country, excluding three western tributaries of the Indus (Indus, Jhelum, and Chenab).
How is the availability of water distributed across geographic regions?
According to the CWC report, Brahmaputra (592.32 BCM), Ganga (581.75 BCM), and Godavari (129.17 BCM) were the top three basins with the highest water availability across the country, while Sabarmati (9.87 BCM), Pennar (10.42 BCM), and Mahi (13.03 BCM) were bottom three basins in terms of water availability.
| Basin | Water Availability (BCM) |
| Barak & Others | 93.65 |
| Brahmani-Baitarani | 31.27 |
| Brahmaputra | 592.32 |
| Cauvery | 26.53 |
| Eastern Flowing Rivers Between Mahanadi & Pennar | 23.33 |
| Eastern Flowing Rivers Between Pennar & Kayakumari | 27.06 |
| Ganga | 581.75 |
| Godavari | 129.17 |
| Indus (Eastern) | 47.30 |
| Krishna | 86.32 |
| Mahanadi | 72.82 |
| Mahi | 13.03 |
| Minor Rivers draining into Myanmar & Bangladesh | 31.86 |
| Narmada | 49.45 |
| Pennar | 10.42 |
| Sabarmati | 9.87 |
| Subarnarekha | 14.48 |
| Tapi | 20.98 |
| Western Flowing Rivers from Tadri to Kanyakumari | 116.47 |
| Western Flowing Rivers from Tapi to Tadri | 110.44 |
| Western Flowing Rivers of Kutch & Saurashtra including Luni | 26.95 |
| Total | 2115.95 |
What were the findings of the previous assessments?
The 2,115.95 BCM figure is higher than the previous estimate made in 2019, which calculated water availability from 1985 to 2015 to be at 1,999.2 BCM.
About a half a dozen water availability assessments, using various methodologies, had been carried out prior to 2019. All of these found water availability to be under 2,000 BCM, with the earliest estimate in 1901-03 giving a 1,443.2 BCM.
This is primarily due to methodological factors. First, the new assessment takes into account Bhutan’s contribution to the Brahmaputra, which was not included in the assessment conducted in 2019. Second, while Nepal’s contribution to the Ganga was only partially taken into account in the 2019 assessment, the current study includes it fully.
According to the CWC, “The current study includes all trans-boundary water entering India in the Brahmaputra basin, in the Ganga basin and in the Indus basin (eastern rivers).”
Why is such an assessment significant?
The assessment of water availability is significant for the sustainable management of water resources, which face challenges from factors such as urbanisation, industrialisation, and climate change.
It is also a prerequisite to calculate the per capita water availability, which is one of the indicators used for measuring water scarcity. According to the most common method for calculating water scarcity, known as the Falkenmark Indicator or Water Stress Index, a country would be deemed to be under “water stress” if the per capita water availability in a country is below 1,700 cubic meters. A per capita water availability of under 1,000 cubic meters puts a country in “water scarcity”, whereas a per capita water availability of below 500 cubic meters means “absolute water scarcity”.
According to the Ministry of Jal Shakti, the average annual per capita water availability for the year 2021 was 1,486 cubic meters based on annual water availability of 1,999.2 BCM assessed in the CWC’s 2019 study. Taking the latest assessments into account, this figure will be higher (1,513 cubic meters for 2024 using a projected population figure of 1.398 billion) but still below the 1,700 cubic meters mark.
Is all available water utilisable?
The CWC’s numbers, however, do not refer to water that is utilisable. For instance, in 2019, the average water resources availability was assessed at 1999.2 BCM, but the utiliSable surface water resources were estimated to only be 690 BCM.
As per the CWC, the proportion of utilisable surface water resources to average water resources potential is very high in smaller basins except in West Flowing River basins from Tapi to Tadri and Tadri to Kanyakumari, Sabarmati and Mahi. The proportion of utilisable surface water resources to average water resources potential is found to be minimum in Brahmaputra sub-basin, as per the CWC.