Economists at the public sector Bank of Baroda have published a report about the finances of Indian states for the financial year ended March (FY2024). The report analyses state-level finances based on three variables: how much money they raised on their own, how much they spent to boost productive capacities of the state, and how much they borrowed from the market.
The report found that most states were able to limit their fiscal deficit (the amount of money they had to borrow to bridge the gap between expenses and income) within the budgeted levels (Chart). This is a significant achievement, since over-borrowing by states adds to the Centre’s over-borrowings, and ultimately leaves less money for private sector firms to borrow.
 Chart and Table 1.
Less investible funds imply higher borrowing costs for everything from home and car loans to factory loans. It is particularly noteworthy that large states such as Gujarat, Maharashtra, Odisha, and Tamil Nadu undershot their budgeted borrowings by over 30%.
Capital spends
The second important finding was regarding capital expenditures (capex) by state governments. This is the kind of spending that goes into making productive assets such as roads and bridges, which boost economic activity in the state. Typically, when governments try to meet fiscal deficit targets, they tend to cut on capex, which in turn, tends to undermine the ability of the state economy to grow faster.
Taken together, states managed to spend only 84% of their capex budget. (Table 1) There were four outliers (in green) — Uttar Pradesh, Telangana, Bihar and Sikkim — that either spent the full amount or went beyond the target. Three states (in pink) — Punjab, Chhattisgarh, and Nagaland — spent less than 50% of their capex budget.
Tax revenues
A state’s total tax revenues can be broadly divided into two heads: own tax revenues (OTR), and share in Union taxes.
The researchers found that overall, OTR accounted for around 61% of tax revenues of states. Within the OTR, GST (Goods and Services Tax) collections made up the biggest chunk (almost 32%), followed by state excise and sales tax (22%) and stamp and registration (7%).
Story continues below this ad
A higher share of OTR helps a state to be more fiscally resilient. Telangana had the highest share of OTR in total tax revenue (82%), closely followed by Haryana (79%), Karnataka (78%), Kerala (77%), Maharashtra (73%), and Tamil Nadu (71%).
Consumption divide
It is here that the analysis throws up some interesting data. Look at Table 2, which tabulates the per capita GST collections for each of the 25 states analysed by the researchers.
GST is a consumption-based tax — that is, it is paid at the point where a good or service is consumed. So, if a car is made in Tamil Nadu but bought in UP, then GST is levied and collected in UP.
As such, per capita GST collection can be used as a proxy for state-wise consumption patterns. Consumption levels, in turn, are a proxy for income levels. Although a proxy, this is the latest and actual observed all-India data as against the last consumption expenditure survey data from 2022-23, Madan Sabnavis, chief economist of Bank of Baroda, said.
Story continues below this ad
“The distribution of per capita GST across states is a reflection of consumption taking place in the country,” the paper says. “…Higher consuming states end up paying higher taxes like GST and sales tax/ excise duty. Those [states] where consumption capacity is constrained have to depend progressively on more transfers from the Union taxes as directed by the Finance Commission.”
Table 2 shows the average per capita GST collection of the 25 states considered by the researchers was Rs 7,029. This level marks the point of division. If one considers only the bigger states (with at least 10 Lok Sabha seats) two divides are visible.
Table 2.
NORTH-SOUTH DIVIDE: States in North India (highlighted in yellow) fall well below the national average, while states in the South (highlighted in green) pull up the national average. Per-capita GST levels in Karnataka or Telangana are almost 3-4 times that of Madhya Pradesh and Jharkhand, which shows the relative lack of prosperity of the average citizen in the latter states.
EAST-WEST DIVIDE: There is a divide between some of the big states in the East and West. Consumption levels in Maharashtra and Gujarat (in pink) are far in excess of those in Odisha, West Bengal and Assam (in blue).
Story continues below this ad
There are some exceptions — such as Haryana in the North — but a broad divide is clearly visible.
Political significance
Counting of votes is scheduled for June 4, and the next five years are going to be critical for both the Indian economy as a whole, and for the way the economies of individual states perform.
As the political map stands today, the BJP-led NDA is on a relatively stronger footing in the lower-consumption (poorer) states of the North (yellow), while the Congress-led INDIA is relatively better placed in the higher-consumption states of the South (green).
This is interesting because the Congress is often seen as the more left-of-centre economic alternative while the BJP is pegged as the right-of-centre party. This perception centres mainly around the role of government that each coalition sees in the running of the economy.
Story continues below this ad
The NDA, especially under Prime Minister Narendra Modi, has repeatedly said it wants “minimum government”, that is, to reduce the government’s involvement in the running of the economy. The INDIA bloc, on the other hand, has indicated a preference for bigger government, especially with its promises to recruit more people and provide a much bigger social safety net.
Despite its more conservative economic ideology, the BJP has implemented a wide range of social welfare measures, creating a class of labharthis that has paid significant electoral dividends. It is often argued that the BJP has been able to deliver social welfare more efficiently than the Congress and its allies, which has put it ahead in the poorer states.
The East-West divide is equally interesting. Here, the NDA-INDIA positions are reversed. So, the BJP has done better in the richer states (pink) while the opposition parties such as the Trinamool Congress and BJD have been ahead in the poorer states (blue).
Maharashtra in the West and West Bengal and Odisha in the East are key battleground states that will be closely watched on June 4. In the light of the research data summarised above, it will be interesting to see whether economic well-being is an important factor in the voting decisions made by the mass of electors.

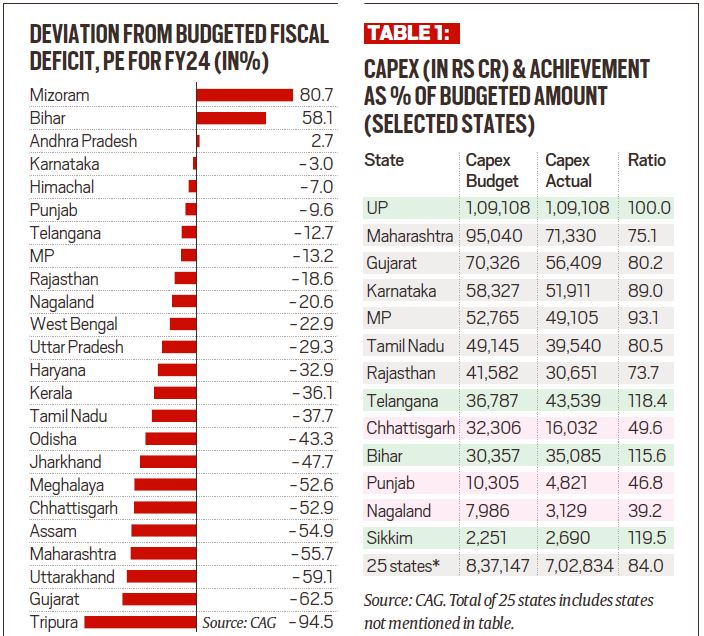 Chart and Table 1.
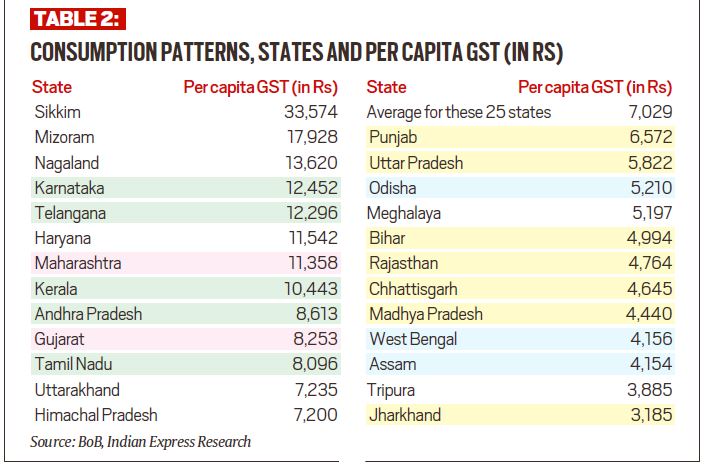 Table 2.