© The Indian Express Pvt Ltd

 The May 13 result might also determine the way the wind blows in the state come next year, with Karnataka accounting for 28 Lok Sabha seats. (PTI/Express)
 The May 10 battle for Karnataka is important for more than one reason. For the Congress, it is a fight for survival, with the Karnataka result set to affect its fate in two of the only three states it holds power now, where elections are due later this year (Chhattisgarh and Rajasthan).
The May 13 result might also determine the way the wind blows in the state come next year, with Karnataka accounting for 28 Lok Sabha seats.
One of the country’s economic powerhouses, which contributes significantly to the national GDP, Karnataka is also the sixth largest state in terms of area, eighth largest by population, the fourth biggest economy in terms of the size of its Gross State Domestic Product (GSDP), and performs better than the national average on key socio-economic indicators such as poverty, literacy rate, growth, inflation, and employment.
Ten charts which show where Karnataka stands compared to the rest of the country:
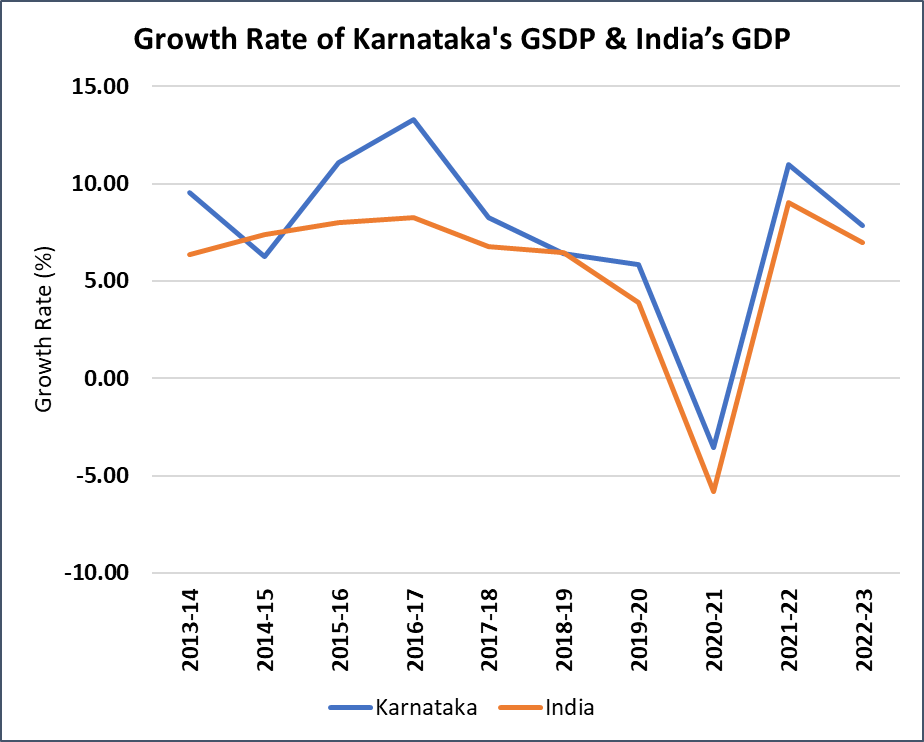
This has been the case for the last several years, with the state’s GSDP (Constant Price 2011-12) seeing a rise from Rs 12.30 lakh crore in 2021-22 to Rs 13.26 lakh crore in 2022-23 – a growth of 7.6%. In the corresponding period, the Indian economy rose by 7%.
Only twice in the last 10 years – 2014-15 and 2018-19 – Karnataka’s GSDP growth was slightly lower than the country’s GDP growth. During Covid-19 pandemic, the state economy contracted by 3.53%, which was also less than the 5.83% contraction seen in the country’s economy (Graph-1).
In 2021-22, the latest year for which comparable figures are available for all states, Karnataka was the fourth biggest state economy in terms of the GSDP. Only three states – Maharashtra (Rs 20.27 lakh crore), Gujarat (Rs 13.82 lakh crore), Tamil Nadu (Rs 13.45 lakh crore) – were ahead of Karnataka (Rs 12.29 lakh crore).
Even then, Karnataka’s GSDP growth rate (10.96%) was higher than these three, with Maharashtra at 9.3%, Gujarat at 10.76% and Tamil Nadu at 7.99%, in 2021-22.
A sectoral analysis of Karnataka’s GSDP in 2021-22 shows that the service sector was the biggest contributor, with a share as high as 63.16%, followed by industry at 21.48%, and agriculture and allied sectors at 15.36%.
The share of agriculture and allied sectors, and manufacturing has declined over the years.
 Source: GSDP – Constant Prices 2011-12, MOSPI website.
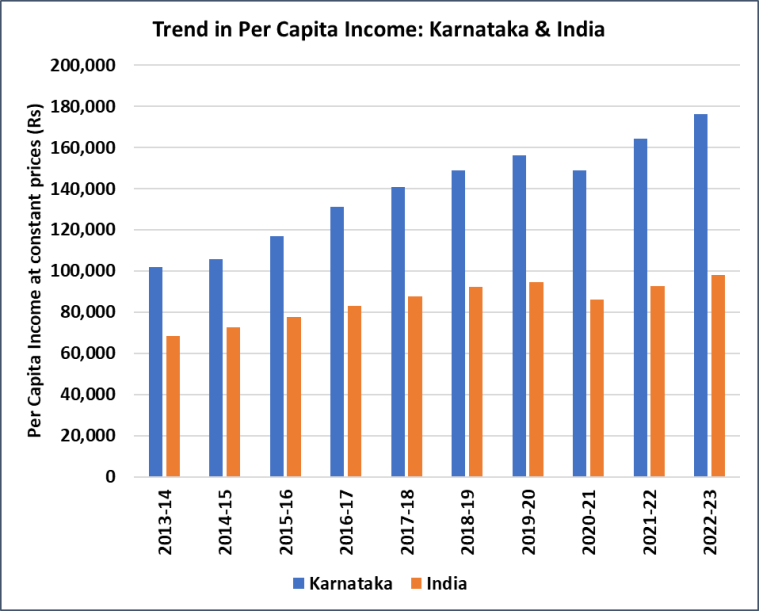
At Rs 1.64 lakh, Karnataka’s per capita income (at Constant Price 2011-12) during financial year 2021-22 was more than 1.5 times the country’s at Rs 92,583 (Graph 2).
Six states – Goa (Rs 3.10 lakh), Sikkim (Rs 2.56 lakh), Delhi (Rs 2.52 lakh), Chandigarh (Rs 2.15 lakh), Gujarat (Rs 1.74 lakh), and Haryana (Rs 1.73 lakh) – recorded higher per capita income than Karnataka.
 Source: Per Capita Net State Domestic Product at Constant Prices; Base Year 2011-12, MOSPI website.
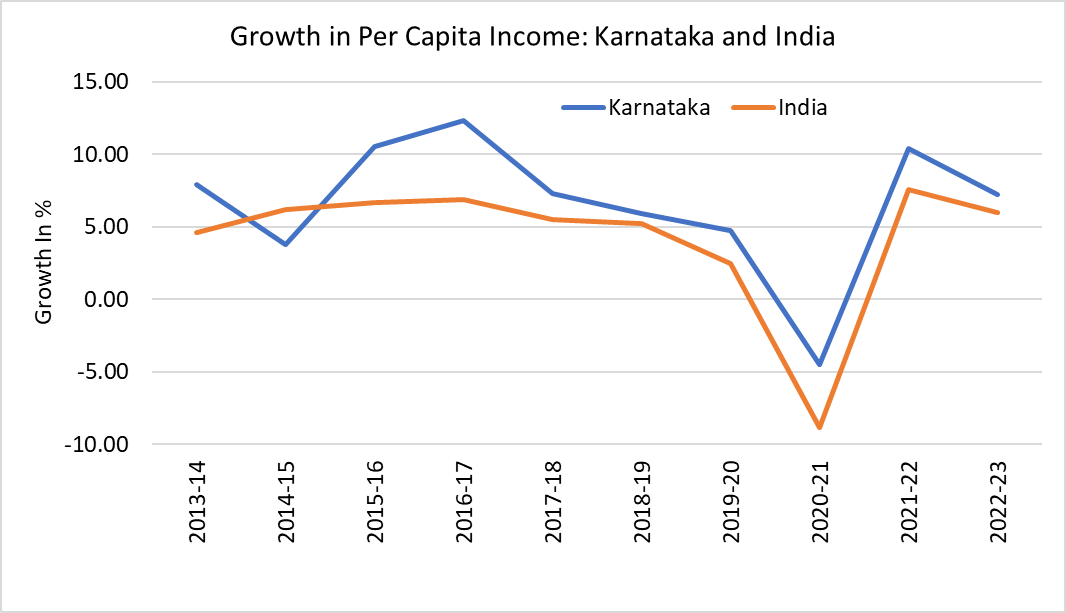
In the last 10 years, the per capita income of Karnataka has registered an annual increase in the range of -4.52% to 10.56% – the only decline coinciding with the 2020-21 Covid years.
In comparison, the country’s per capita income change was in the range of -8.86 to 7.59 per cent.
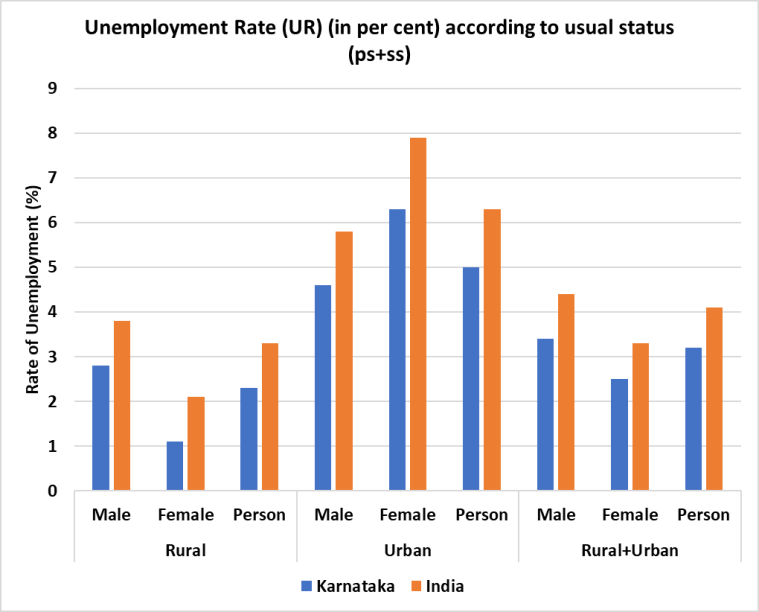
As per the Periodic Labour Force Survey (PLFS), unemployment (according to usual status) was recorded at 3.2% in Karnataka during July-June 2021-22. The comparative all-India unemployment rate in the same period was 4.1% (Graph 4).
In both urban and rural unemployment, Karnataka fared better than the country in this period — 5% as compared to 6%, and 2.3% as to 3.3%, respectively.
All of Karnataka’s neighbouring states fared worse, with Goa unemployment at 12%, Kerala at 9.6%, Tamil Nadu 4.8%, Andhra Pradesh 4.2%, Telangana 4.2% and Maharashtra 3.5%.
 In both urban and rural unemployment, Karnataka fared better than the country in this period — 5% as compared to 6%, and 2.3% as to 3.3%, respectively.
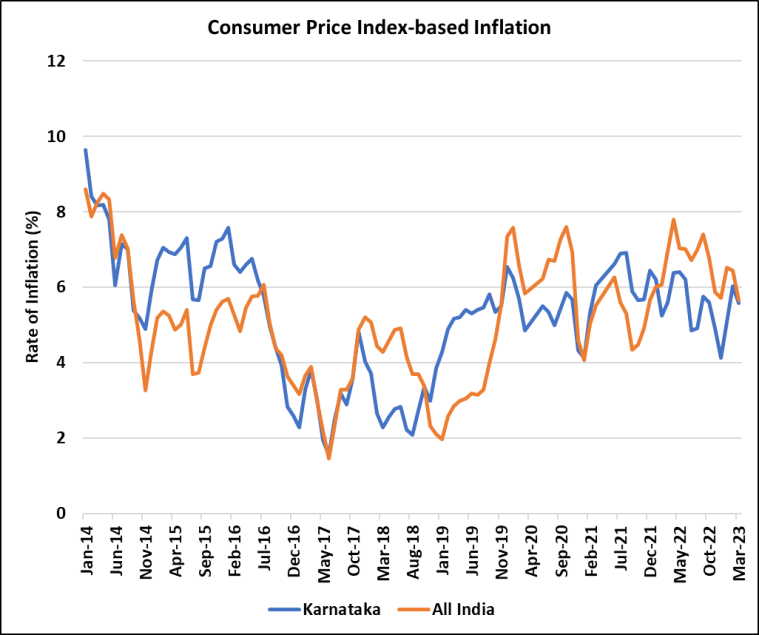
The annual rate of inflation based on the Consumer Price Index (CPI) has been lower in Karnataka than the country for the last one year. In March 2023, retail inflation in Karnataka was recorded at 5.58%, when the country’s figure was 5.66% (Graph 5).
During 2021-22, the value of exports from Karnataka stood at $25,874.50 million, 6.13% of India’s total exports of $4,22,004.42 million. Only three states – Gujarat ($1,26,805.21 million), Maharashtra ($73,119.50 million) and Tamil Nadu ($35,169.43 million) – were ahead of Karnataka (Graph 6).
The top 10 districts in Karnataka contributing the most in exports are Dakshina Kannada, Bengaluru Urban, Bengaluru Rural, Kolar, Ballari, Mysuru, Belagavi, Tumakuru, Hassan and Udupi.

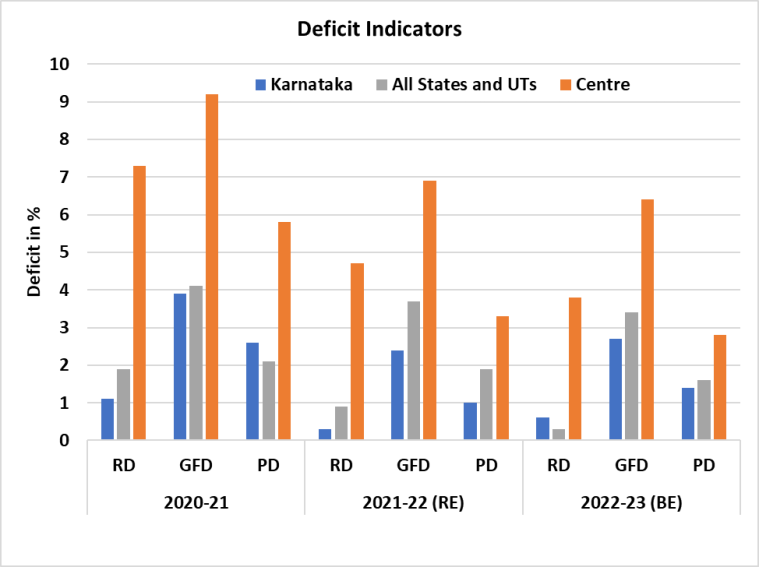
Karnataka’s performance on deficit indicators namely Revenue Deficit, Gross Fiscal Deficit and Primary Deficit has been better than the Centre and average of all states in recent years. Karnataka’s Revenue Deficit, which is defined as the excess of revenue expenditure over revenue receipts, has been lower than the Centre and the average of all states and UTs. The Fiscal Deficit, which is a difference between Revenue Receipts Plus Non-Debt Capital Receipts and the total expenditure, has also been lower. The Fiscal Deficit shows the total borrowing requirement of the government (Graph 7).
The Primary Deficit, which is the difference between Fiscal Deficit and interest payment, has also been lower in Karnataka as compared to the Centre and the average of all states and UTs.
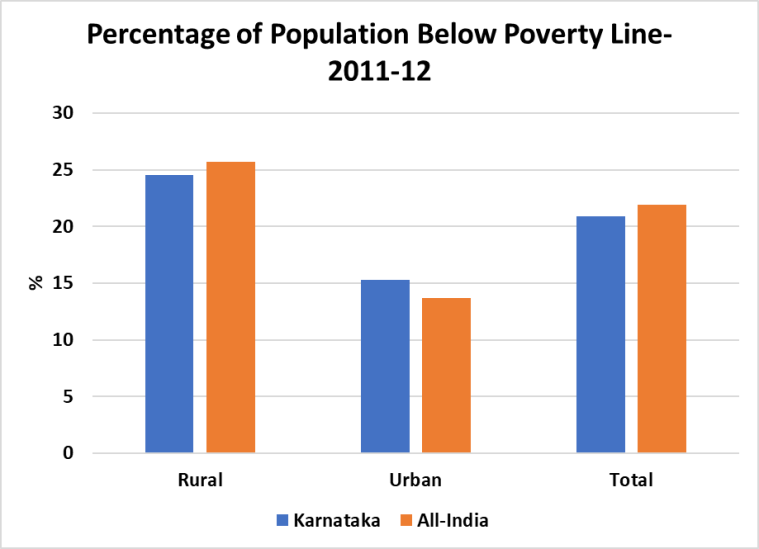
As per the data published in 2013 based on the Tendulkar Methodology, 20.91% people were BPL in Karnataka. The figure was slightly lower as compared to the national figure of 21.92%. However, in urban areas of the state, poverty is higher than the national figure (Graph 8).
Karnataka is the third biggest contributor to the direct taxes kitty, which includes Corporate Tax, Personal Income Tax, and other direct taxes. During the financial year 2021-22, Karnataka contributed Rs 1.68 lakh crore or 12% of the total direct tax collection (Rs 14.12 lakh crore) in the country. Only one state, Maharashtra (Rs 5.24 lakh crore), and Delhi (Rs 1.77 lakh crore) were ahead of Karnataka in terms of contribution to the collection of income tax in the country (Graph 8).
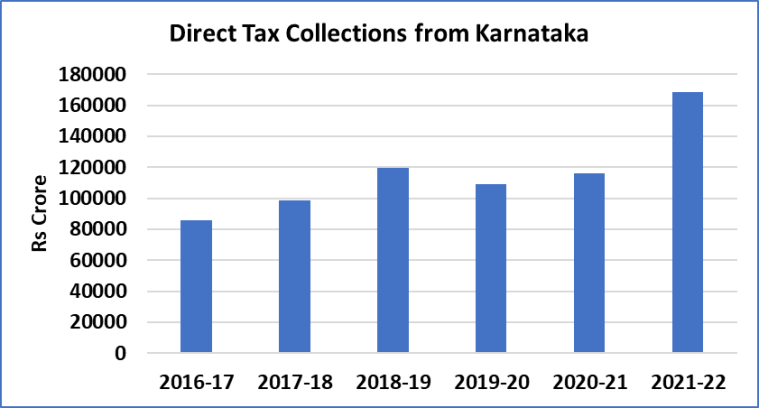
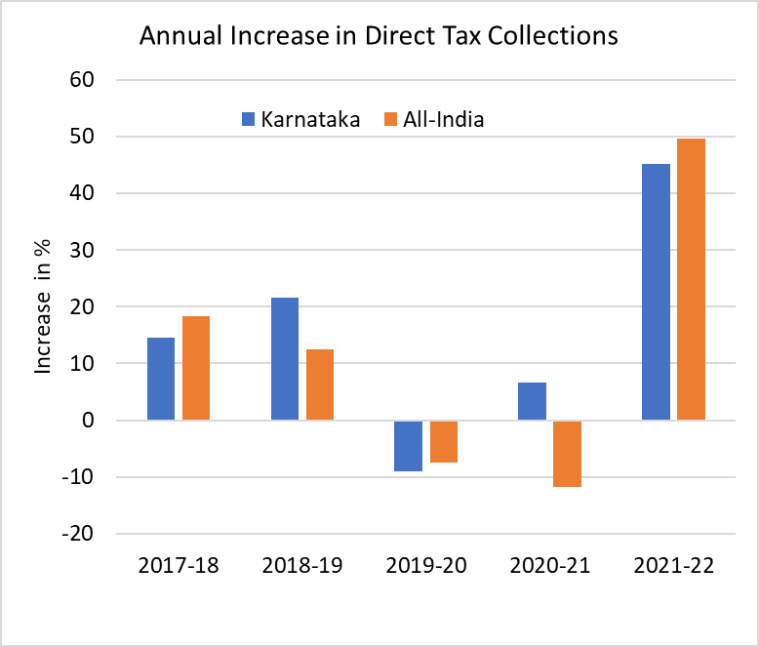
Karnataka is not only a major contributor to the tax kitty, the state has recorded a higher growth in direct tax collection during recent years. In the last five years, there have been three occasions when the annual increase in direct tax collections was higher in Karnataka than in the country (Graph 10).
Even during Covid-19 pandemic, direct tax collections recorded over 6% growth, as compared to a decline of 12% at the national level.