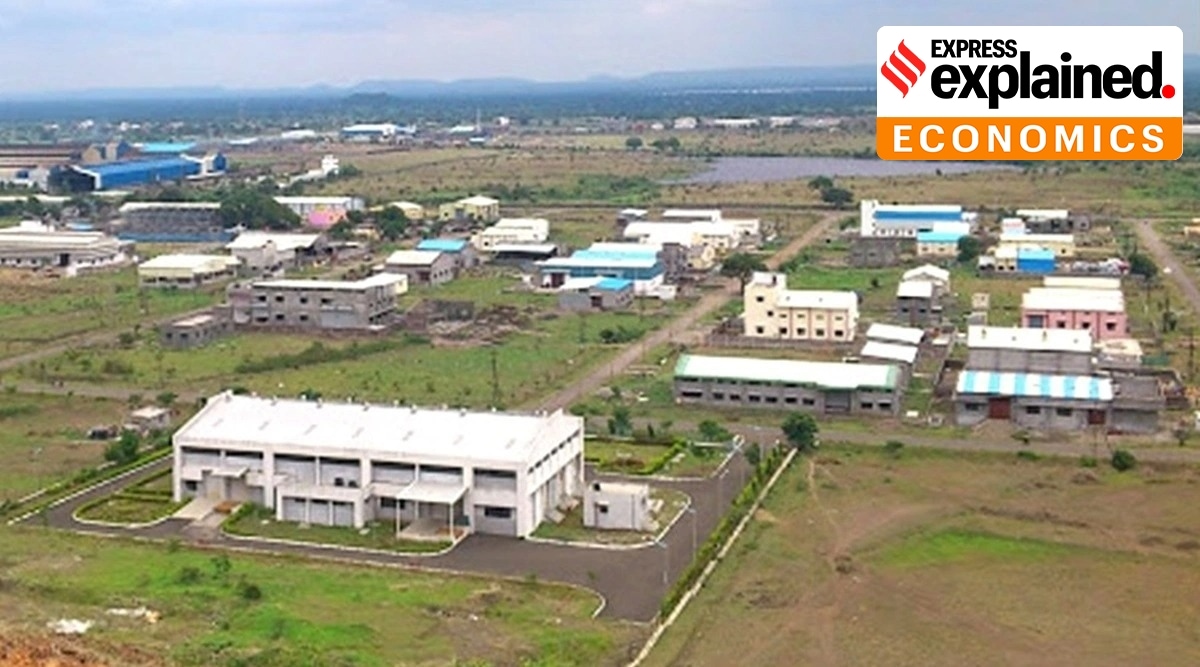
The year preceding the onset of the Covid-19 pandemic, 2019-20, saw the number of factories in the country increasing by 1.7 per cent year-on-year to 2.46 lakh, which employed a total 1.3 crore workers, as per provisional results of the Annual Survey of Industries (ASI) released by the Ministry of Statistics and Programme Implementation.
ASI results for employment, investment

The data show that employment in the corporate sector, which includes public and private government and non-government companies, increased 5.5 per cent to 97.03 lakh in 2019-20, while employment in individual proprietorship declined 3.1 per cent to 11.36 lakh.
Employment in the partnership sector fell by 11.7 per cent to 18.58 lakh in 2019-20 while that for limited liability partnership grew 42 per cent to 1.22 lakh, the ASI results show.
The number of factories grew 1.7 per cent to 2.46 lakh in 2019-20. This compares with a growth of 1.98 per cent in the number of factories to 2.42 lakh in 2018-19, and a 1.2 per cent growth seen in the post-demonetisation year of 2017-18.
Employment in the previous fiscal of 2018-19 had shown a 5.8 per cent growth in the corporate sector, a 2.88 per cent growth for the partnership sector. It showed a 1 per cent decline in individual proprietorship in 2018-19 after rising for the two previous financial years.
Buy Now | Our best subscription plan now has a special price
Gross fixed capital formation, an indicator of investment, grew 20.5 per cent to Rs 4.15 lakh crore in the organised manufacturing sector in 2019-20 as against a growth of 10.2 per cent at Rs 3.44 lakh crore in the previous fiscal, the data show.
Story continues below this ad
In 2019-20, urban areas had 1.43 lakh factories with a fixed capital of Rs 13.64 lakh crore, employing 72.79 lakh workers, while the rural sector had 1.03 lakh factories with a fixed capital of Rs 22.71 lakh and employing 57.78 lakh workers, the data show.
Significance and state-wise employment
These numbers assume significance as these are the results for the “normal” year of 2019-20 before the beginning of the Covid-19 pandemic, which affected employment growth.
The ASI data relates to factories employing 10 or more workers using power and those employing 20 or more workers without using power, and is the principal source of industrial statistics and data for organised manufacturing.
Story continues below this ad
Among the states, Tamil Nadu shows the highest employment of workers in factories at 22.09 lakh in 2019-20, followed by Maharashtra with 14.54 lakh workers, and Gujarat with 15.89 lakh workers. This compares with 21.12 lakh workers in factories in Tamil Nadu in 2018-19, followed by 14.89 lakh workers in Gujarat and 14,73 lakh workers in Maharashtra.
Newsletter | Click to get the day’s best explainers in your inbox
Total wages paid to workers grew 6.3 per cent in 2019-20 as against a wage growth of 11.9 per cent in the previous fiscal. Wages to factory workers in the corporate sector rose by 7.7 per cent in 2019-20.
Workers figures include all persons employed directly or through any agency whether for wages or not and engaged in any manufacturing process or in cleaning any part of the machinery or premises used for manufacturing process or in any other kind of work connected with the manufacturing process.
Story continues below this ad
Labour engaged in the repair & maintenance, or production of fixed assets for factory’s own use, or employed for generating electricity, or producing coal, gas etc. are also included in the count of workers.
Number of factories, workers as per Annual Survey of Industries:


