© The Indian Express Pvt Ltd
Journalism of Courage

 Workers making designer mud pots in Tripura. (Express photo by Abhisek Saha)
 Between 2004 and 2018, there has been an upward trend of economic mobility for sons of fathers engaged in casual wage employment as they are now less likely to take up casual wage employment. Instead, sons of casual wage workers are now increasingly moving towards informal, semi-formal, and formal regular wage work. But there’s a caveat– the upward trend has been weaker for Scheduled Caste (SC) workers as compared to general caste workers.
The presence of an employed mother-in-law is a major determinant of whether or not married women join the workforce. The presence of unemployed mothers-in-law in the same house significantly reduces the likelihood of married women being employed whereas the presence of employed mothers-in-law only slightly reduces the likelihood, when compared to households where there are no mothers-in-law.
The ‘State of Working India 2023’ report was released by Azim Premji University’s Centre for Sustainable Employment on Wednesday (September 20). It uses data sources like the National Statistical Office, including Employment-Unemployment Surveys and the Periodic Labour Force Surveys, and has revealed major trends in India’s labour market. Here’s a look at seven charts from the report on intergenerational mobility and women’s workforce participation rates:
Chart 1: Changing composition of employment type, based on caste
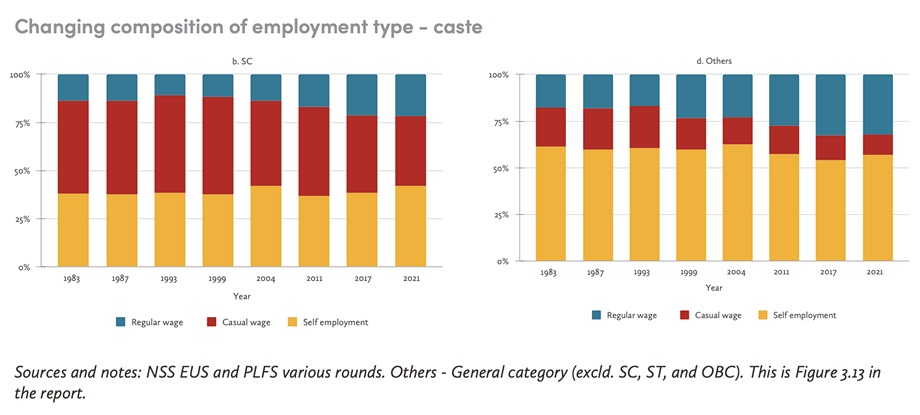 Chart 1 on employment type for workers by caste.
Between 1983 and 2021, the proportion of regular wage workers belonging to the SC category has increased even though it is significantly lower than the proportion of regular wage workers belonging to the general caste category (described as “Others” in the graph).
In 2021, 32% of general caste workers were in regular wage employment as compared to 22% of SC workers.
There is also a higher rate of self-employment amongst general caste workers as opposed to SC workers. The report also looks at firm ownership data to conclude that general castes are over-represented to a greater degree in larger enterprises.
Chart 2a: Intergenerational mobility matrices over time disaggregated by caste, for SC/ST groups
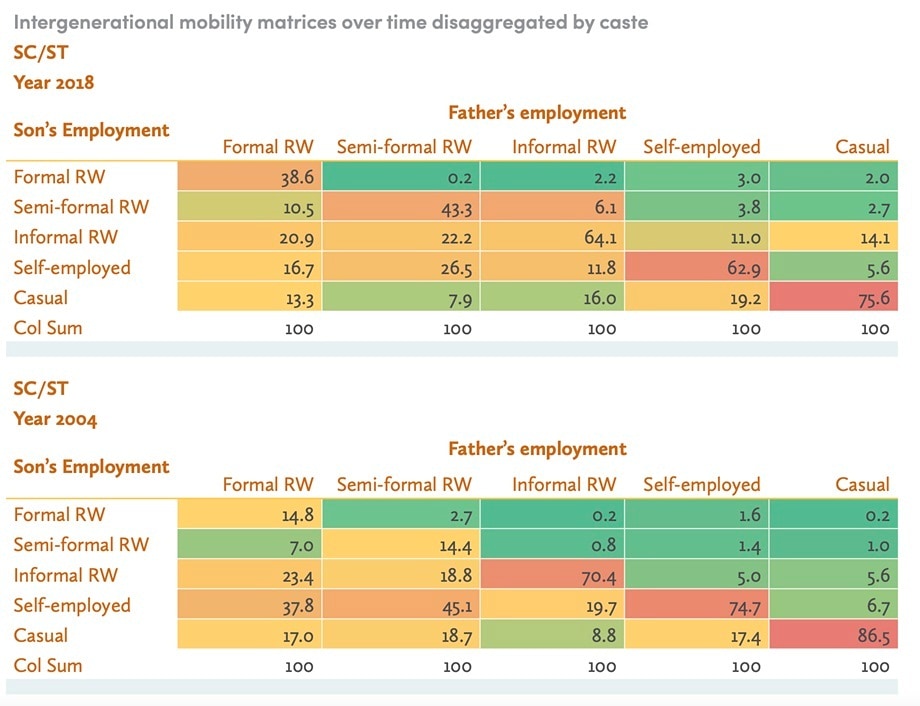 Chart 2a on economic mobility for SC/ST groups.
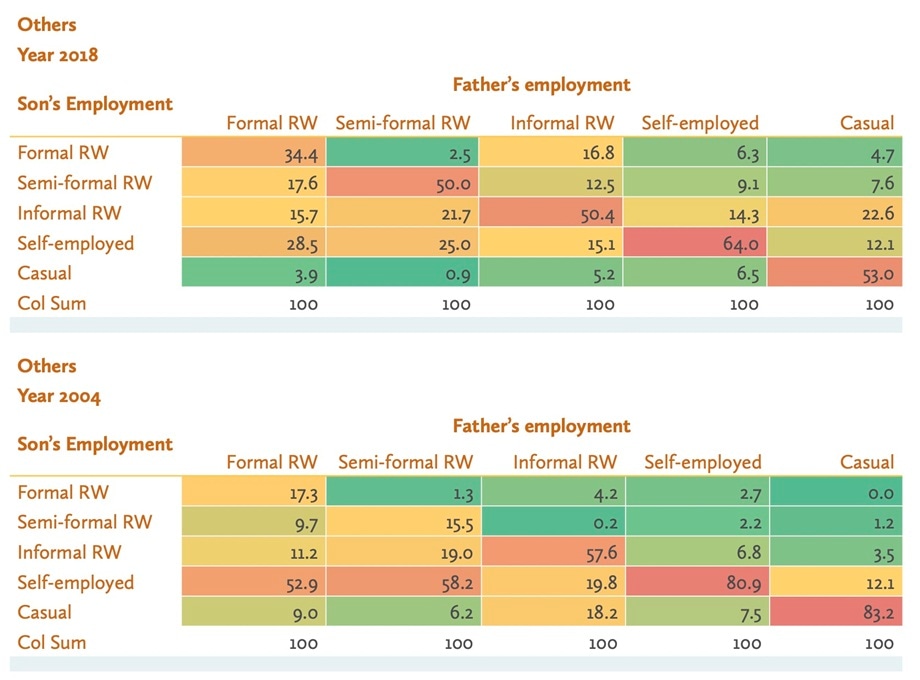 Chart 2b on economic mobility for general groups.
In 2018, 75.6% of sons of SC/ST casual wage working fathers were themselves casual wage workers, a dip from 86.5% in 2004. A steeper fall is noticed for sons of general caste (described as “Others” in the graph) casual wage working fathers, to 53% in 2018 from 83.2% in 2004. In other words, economic intergenerational mobility has been more pronounced for general caste casual wage workers than for SC/STs.
In 2018 as compared to 2004, sons of casual wage workers moved away from casual wage work to informal, semi-formal, and formal regular wage (RW) work. For instance, in 2004 only 0.2% of SC/ST fathers in casual wage work had sons in formal RW work. In 2018, that number jumped to 2%. For general caste fathers in casual wage work, the number jumped from 0% to 4.7%.
The employment type with the highest intergenerational persistence, i.e. the highest probability that a father’s son works in the same profession as him, is casual wage work. In comparison, formal RW work is much less persistent.
Chart 3: Industries showing an overrepresentation of Women, SCs
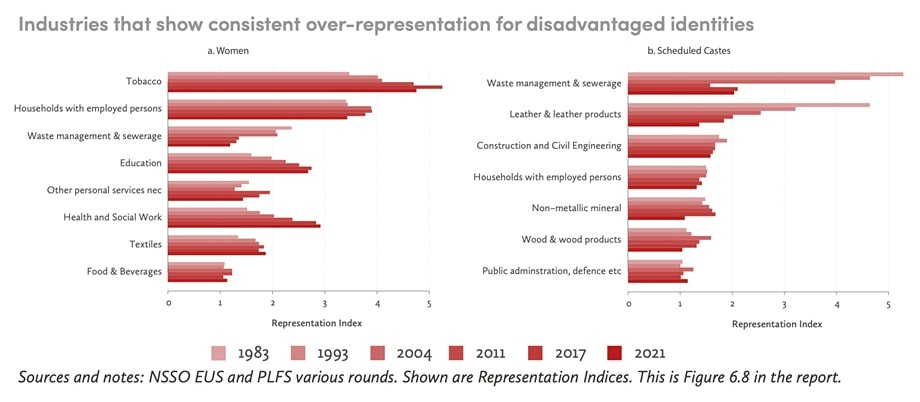 Chart 3 on the representation of women, SCs in industries.
Between 1983 and 2021, the degree of women’s representation in industries like tobacco, education, health and social work, and textiles has increased whereas in waste management & sewerage, it has decreased. Still, in all these sectors, women are over-represented in comparison to men.
In the same period, the degree of SC representation in industries like waste management & sewerage and leather & leather products has fallen sharply, even though SCs continue to be over-represented in comparison to other castes. In industries like non-metallic minerals and wood & wood products, the degree of SC representation increased until 2021 when it fell to levels similar to or below 1983.
Chart 4: Relationship between husband’s earnings and probability of women’s employment
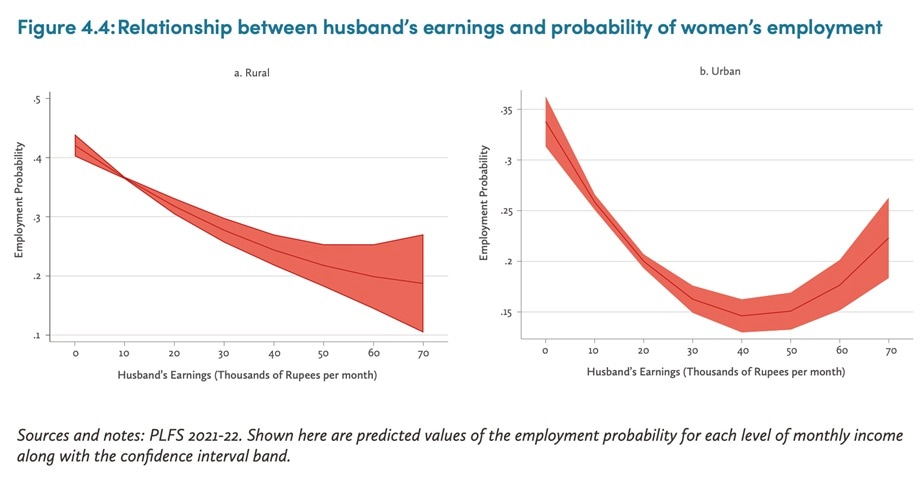 Chart 4 on the relationship between husband’s earnings and women’s employment.
Due to the “male breadwinner” norm, as the husband’s income increases the probability of the wife being employed also reduces. In rural areas, the fall in probability slows down as the husband’s income increases.
In urban areas, we see a U-shaped pattern which indicates that there is a fall in the probability of the wife being employed up to an earnings threshold of Rs. 40,000. As the husband’s earnings increase beyond Rs. 40,000, the probability of the wife being employed also increases.
This is the case because husbands in higher income brackets have better-educated wives who have aspirations and access to good-paid work. The rural/urban divergence is likely due to the fact that urban women are not only better educated but also have more access to good, paid work.
The report also finds that as compared to households where there is no mother-in-law present, married women in households with an unemployed mother-in-law are 20% (rural) to 30% (urban) less likely to be employed. However, if the mother-in-law is employed, the likelihood of the married woman being employed jumps from 50% (rural) to 70% (urban). In other words, the presence and employment status of mothers-in-law is a strong determinant of whether or not married women are participating in the workforce.
Chart 5: Female workforce participation rates by education for 2021-22
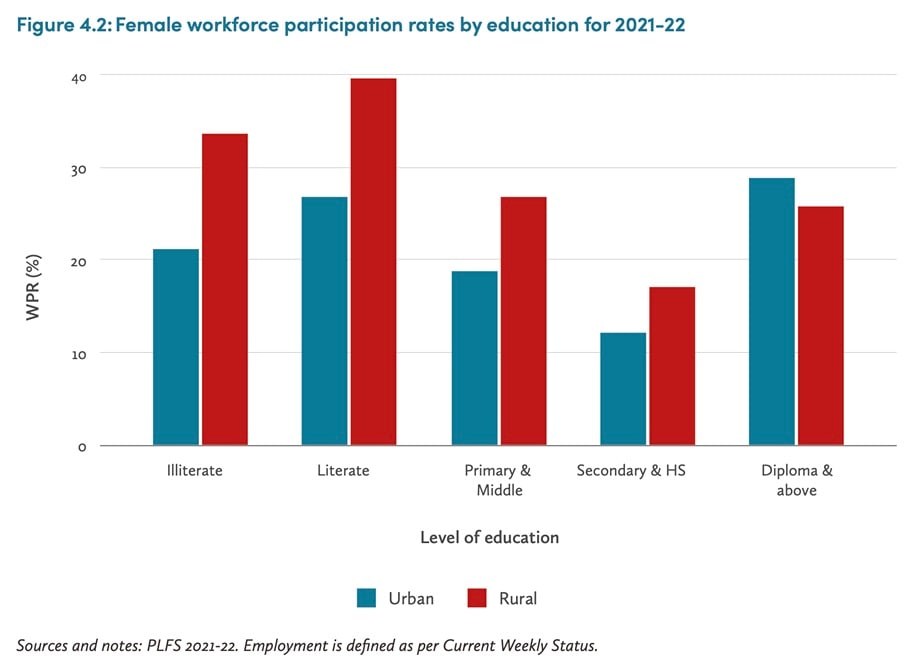 Chart 5 on female workforce participation rates by education for 2021-22.
Except for the education level “diploma and above”, women in rural areas have higher workforce participation rates for all levels of education compared to women in urban areas.
The U-shaped trend in urban women’s workforce participation rates as the education level increases indicates that as growth continues and female education levels rise, women are presented with employment opportunities with higher wages which pull them into the workforce. However, it must be noted that there is an incongruence between the demand for such jobs, which is high, and the supply, which is struggling to keep up.
The report also notes that as of 2021-2022, about 40% of SC women were in employment as opposed to only 21% of general caste women.
Chart 6: On the rising share of workers in the non-agricultural sector, compared to organised/regular wage employment sectors
 Chart 6 on the rising share of workers in the non-agricultural sector, compared to organised/regular wage employment sectors.
Since the 1980s, the share of workers employed in non-agricultural sectors increased significantly, with the figure standing at 19.8% in 2021. Notably, the figure went up to 20.3% in the late 2010s before reducing to the current level.
The exodus of workers from agricultural employment has not been absorbed by the organised sector or by salaried employment, which has shown stagnant growth in recent years. In other words, those moving out of the agricultural sector have been taking up casual wage labour work or informal regular wage work in construction or services.
Chart 7: Unemployment in India is concentrated among its educated youth
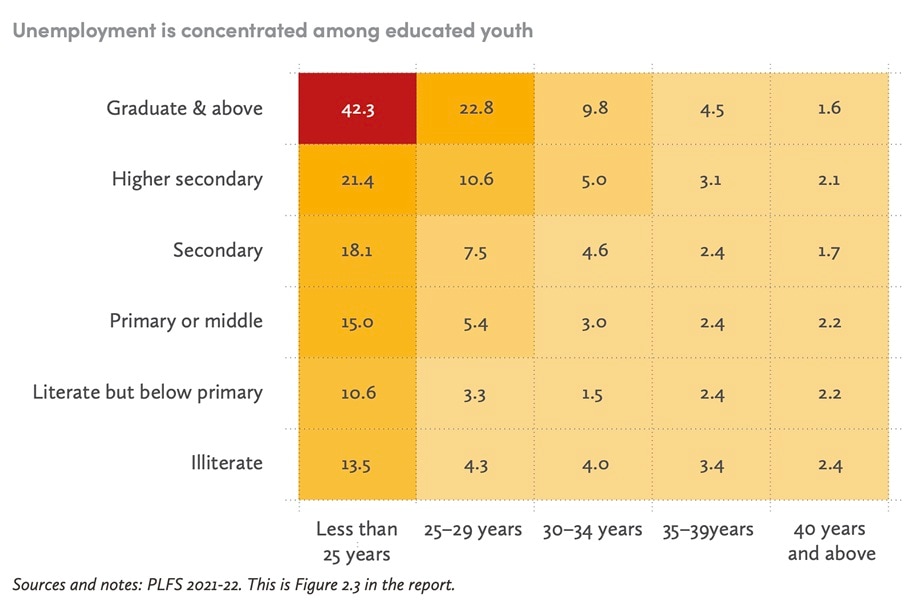 Chart 7 on unemployment among India’s educated youth.
Graduates under 25 years have the highest unemployment rate among all education levels for the same age group. The unemployment rate reduces as the education level decreases. Expectedly, as a person grows older, the probability of them being employed also increases mostly because unemployment becomes unsustainable.
Even though the unemployment rate is lower than what it was before the coronavirus pandemic, the report reveals that over 15% of graduates are unemployed.