© The Indian Express Pvt Ltd

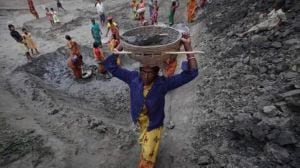
 A potato farmer oversees workers at Gukhrauli village in Uttar Pradesh’s Hathras district. (Express Photo by Harish Damodaran)
Terms of trade (ToT) for Indian agriculture — movement in prices of farm commodities relative to that of non-farm goods and services — have recorded significant improvement in the last decade and a half, going by data derived from national income statistics.
ToT can be calculated using so-called implicit price deflators. Gross Value Added (GVA) — the value of all goods and services produced in an economy minus the value of their inputs consumed during a given year, net of product taxes and subsidies — is estimated at both current and constant prices. Current prices are price levels for the given year, while constant prices are those that prevailed during a fixed “base” year.
The deflator is the ratio of GVA at current prices to the GVA at constant prices, thereby also a measure of inflation relative to the base year. The implicit price deflator can be worked out for the economy’s individual sectors — agriculture and allied activities, industry and services — as well. The deflator for agriculture GVA divided by that for non-agriculture GVA, then, gives the ToT for the farm sector in a given year.
Favourable movement
NITI Aayog member Ramesh Chand and consultant Jaspal Singh have shown that the ToT for agriculture relative to the non-agriculture sector (with a 2011-12 base value of 100) fell from 90.2 in 1973-74 to 72.2 by 1985-96 and didn’t recover much even till the mid-2000s, when it reached 85 levels.
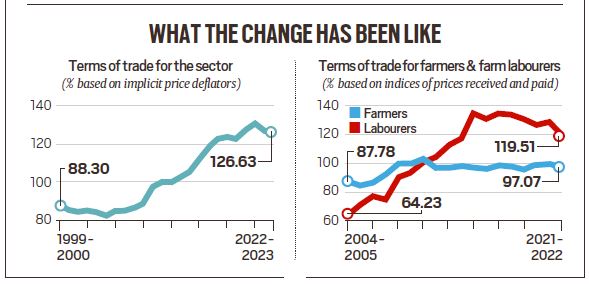
The real recovery happened only from 2009-10, when the ToT hit 97.6 and continued to rise, peaking at 130.2 in 2020-21 before marginally easing to 126.6 in 2022-23 (Chart 1).
Chand and Singh have ascribed the pickup in India’s agricultural growth rate — to an estimated average of 3.7% per annum between 2005-06 and 2021-22 — largely to the improved ToT for the sector. The latter was, in turn, courtesy of the global agri-commodity price boom from roughly 2004 to 2014, plus policy interventions, especially minimum support price (MSP) hikes for crops, by the governments of both the previous United Progressive Alliance and the current National Democratic Alliance.
What it means for farmers and farm workers
The ToT based on implicit price deflators is a broad-based indicator of how prices for agricultural commodities have moved vis-à-vis for non-agricultural goods and services. It does not show whether and how much the ToT has improved for those actually engaged in crop production: farmers and agricultural labourers.
The Agriculture Ministry maintains data on both the prices received by farmers for the produce they sell and the prices paid for the products bought by them. The latter include final consumption items (from purchased foods to toilet soap, toothpaste, medicines, mobile services, two-wheelers and gold jewellery), intermediate inputs (seed, fertiliser, pesticides, livestock feed, irrigation charges, diesel, hired labour, marketing costs and interest on loans) and capital goods (tractors, electric motor/pumps, cement, bricks, steel and other construction materials).
Based on the above, the Ministry has constructed year-wise indices of prices received (IPR) and prices paid (IPP) with the three years ended 2011-12=100 as base value. The ToT for farmers is the ratio of IPR to IPP. A ratio above one (or 100%) implies their enjoying favourable pricing power, in terms of what they sell versus what they buy. A ToT ratio below one indicates unfavourable conditions of exchange.
The Ministry has, likewise, constructed year-wise IPR for agricultural labourers, which is basically wages received by them. The IPP in their case is only for final consumption items. Agricultural workers, unlike farmers, have just their labour power to sell, with the money from it also mainly spent on consumption goods.
The results are summarised in Chart 2. The farmers’ ToT ratio went up significantly — by 17.3%, from 87.8 to 102.9 — between 2004-05 and 2010-11. It has, however, fallen thereafter and stagnated at 97-99 levels. The agricultural labourers’ ToT ratio rose more spectacularly, by 109.2% from a mere 64.2 in 2004-05 to 134.4 in 2016-17. But even it has registered a decline to 119.5 in the last computed year of 2021-22.
Simply put, while the ToT for the farm sector as a whole may have improved since the mid-2000s, it has been more for agricultural labourers than for farmers. Moreover, the last few years have been marked by stagnation or deterioration for both.
Political economy implications
Agricultural labourers — a big chunk of them from Dalit, Adivasi or Most Backward Classes backgrounds — have historically occupied the bottom-most rung of India’s socioeconomic ladder.
Accelerated growth in the wider economy from around 2003-04 helped create new employment avenues for them outside of agriculture, particularly in construction and the urban services sector. Together with parallel government interventions such as the Mahatma Gandhi National Rural Employment Guarantee Act and the targeted public distribution system, it led to a tightening of labour markets. Farm workers, in the process, discovered hitherto non-existent alternatives (“opportunity cost”) to transplanting paddy, harvesting sugarcane, picking cotton, spraying insecticides or removing weeds in fields.
The resultant rise in real wages for agricultural labourers, also reflected in their ToT, has impacted farmers. They have been squeezed between higher costs — for not just hired labour, but also agro-chemicals, seed, feed, diesel, tractors and farm machinery, and other inputs — and no commensurate increase in produce prices.
Subsidies on fertiliser, electricity/canal irrigation charges, agricultural credit and crop insurance may have partly protected farmers from rising production costs, just as MSP procurement has ensured stable realisations in select crops like paddy, wheat and sugarcane. But even after factoring these, the ToT for farmers has stagnated at best in the last 10 years. That, along with not many new crop yield breakthroughs and fragmentation of landholdings, probably also explains the clamour for reservations in government jobs and educational institutions by Marathas, Jats, Patidars, Kapus and other dominant agrarian communities.
Even for agricultural labourers, the ToT ratio, while still favourable, has fallen after 2018-19. This is reflected in rural wages, too, hardly rising in real terms after adjusting for inflation.