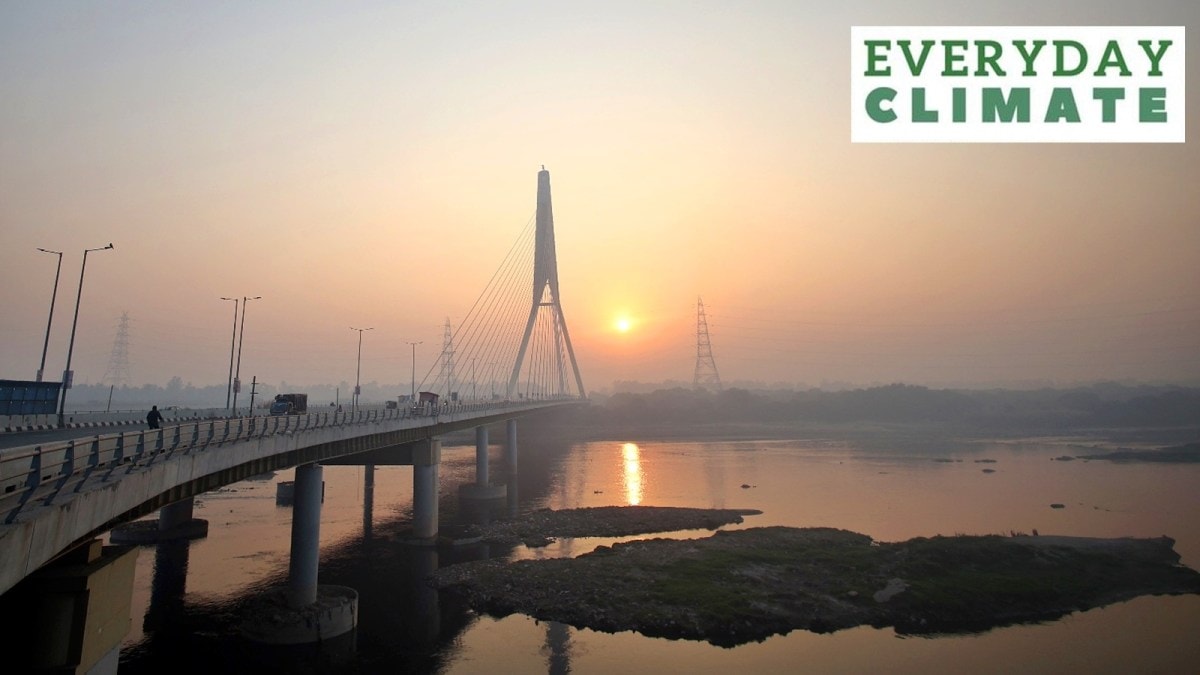
What is AQI — and how is the air quality in Delhi after Diwali this year?
Launched by the central government in 2014 as part of the Swachh Bharat campaign, the AQI was to help simplify the common understanding of pollution.

The Air Quality Index (AQI) in New Delhi was around 351 on Friday afternoon (November 1), the day after Diwali. Despite the ban on firecrackers in the national capital, various parts of the city saw violations.
Factors such as the onset of winter and cool, dense air enveloping the city, road dust and vehicular pollution, and stubble burning in the neighbouring states of Punjab and Haryana also contribute to the dip in air quality this time annually.
What is the air pollution situation in Delhi post-Diwali?
The post-Diwali 24-hour average AQI of 339 on Friday was better than last year when it was 358 (on November 13, 2023). Several factors contributed to this outcome, the most important being meteorological conditions. The wind speed picked up to 10kmph around 9 am, creating favourable conditions for the dispersal of pollutants.
How is the AQI in Delhi compared to last year?
AQI is a number that indicates air quality: the higher the AQI, the worse the air. There are six categories of AQI, namely ‘Good’ (0-50), ‘Satisfactory’ (50-100), ‘Moderately polluted’ (100-200), ‘Poor’ (200-300), ‘Very Poor’ (300-400), and ‘Severe’ (400-500).
The colour-coded AQI index was launched in India in 2014, and it helps the public and the government understand the condition of the air and what subsequent measures are to be taken to combat the situation, based on its severity.
What is the AQI and how does it calculate pollution?
Launched by the central government in 2014 as part of the Swachh Bharat campaign, the AQI was to help simplify the common understanding of pollution. An expert group comprising medical professionals, air quality experts, academia, advocacy groups, and others was constituted and a technical study was awarded to IIT Kanpur. IIT Kanpur and the Expert Group recommended an AQI scheme.
According to the Central Pollution Control Board, part of the Ministry of Environment, Forests and Climate Change, the AQI transforms complex air quality data of various pollutants into a single number (index value), nomenclature and colour. The pollutants measured include PM 10, PM 2.5, Nitrogen Dioxide, Ozone, Carbon, etc.
There is a calculation that goes behind the index. There are six or eight pollutants in the affected air and each of these pollutants is given a weight based on a formula. That weight depends on the kind of impact it has on human health. The worst of these weights is given as composite air quality, so instead of giving you six different numbers, and six different colours, it throws up one single colour, one single number to denote the overall impact. Monitoring stations across the country assess these levels.
What is the impact of pollutants like PM 2.5 and PM 10?
Among the more harmful pollutants are those of a smaller size, such as particulate matter (PM) 2.5, which is an atmospheric particulate matter of a diameter smaller than 2.5 micrometres (or around 3 per cent of the diameter of a human hair). It causes respiratory problems and reduces visibility. The particles can only be detected with the help of an electron microscope because they are so small.
Due to their size, the PM 2.5 particles can easily bypass the nose and throat and can easily enter the circulatory system. The particles can also lead to chronic diseases such as asthma, heart attack, bronchitis and other respiratory problems.
How does the AQI influence government policy?
Based on the air quality levels, the governments in areas like Delhi announce measures. The Graded Response Action Plan (GRAP) has specifically been instituted for emergency measures that kick in to prevent further deterioration of air quality in Delhi-NCR. Previously, it has led to a ban on the use of coal and firewood, including tandoors at hotels, restaurants, and open eateries as well as diesel generator sets (except for emergency and essential services).
It also included a hike in parking charges to discourage the use of private vehicles.
This is an updated version of an explainer published in 2023.