© The Indian Express Pvt Ltd
Journalism of Courage

 Coronavirus lockdown: Clear water is seen in Venice’s canals due to less tourists, motorboats and pollution, as the spread of COVID-19 continues, in Venice, Italy, March 18, 2020. (Reuters Photo: Manuel Silvestri)
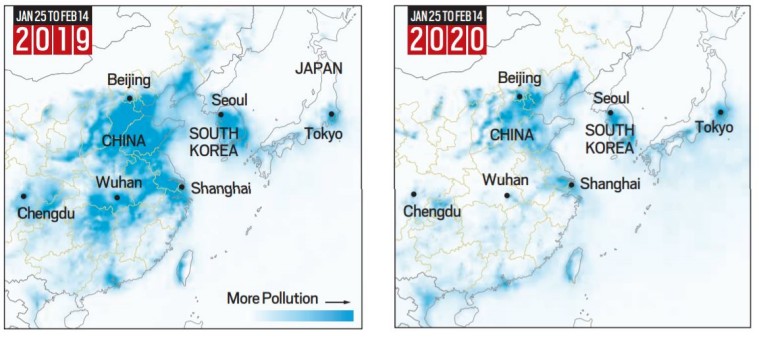
As the coronavirus sweeps through the world, shutting thousands of factories and locking down millions, the impact is visible from space. A satellite that detects traces of human activity — tailpipe emissions, fossil fuel burned in power plants and other industrial activities — shows striking reductions in pollution over China and Italy.
Both countries have taken unprecedented measures to limit the movement of people in order to slow down or contain the spread of the disease.
On January 25, the global death toll was 41, all of them in China. By February 14, 1,383 people had been killed, all but two of them in China. An average 65 new deaths occurred daily in China from January 25 to February 14, peaking at 254 deaths of February 13 before falling to just 13 on February 14. China got some grip on the number of daily deaths thereafter.
 Coronavirus pandemic: On March 18, China recorded 81,102 cases of COVID-19 and 3,241 deaths. The total number of patients were 69,755.
The first two deaths in Italy occurred on February 23, and the toll jumped to 29 a week later on March 1. On March 10, with 463 people dead, Italy shut all schools and colleges. On March 15, the government put the whole country under an unprecendented quarantine lockdown. On Tuesday, all retailers except pharmacies and supermarkets were shut down.
📢 Express Explained is now on Telegram. Click here to join our channel (@ieexplained) and stay updated with the latest
 Coronavirus pandemic: On March 18, Italy recorded 31,506 confirmed COVID-19 cases, 2,503 deaths while 2,941 patients recovered.
Even in South Korea, where the lockdown is not that severe, pollution levels are falling.
Coronavirus: How long can the virus live on surfaces or in air around you?
“It’s the first time in history we’ve seen something live this,” said Marco Percoco, a transportation exonomist at Bocconi University in Milan, referring to the speed and size of the pollution declines.
Source: The New York Times, using Sentinel-5P satelite data processed by Descartes Labs. Pandemic infection and death numbers from John Hopkins University dashboard; Our World In Data, using WHO data.