© IE Online Media Services Pvt Ltd

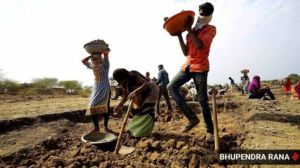
 Worldwide, international arms transfers fell 5.1%, according to SIPRI. SIPRI data finds a place in our key terms. (File photo/Reuters)
 Essential key terms from the last week’s news headlines or between the lines categorised as per the relevance to the UPSC-CSE syllabus along with the MCQs followed.
WHY IN NEWS?
— The ongoing approach to dealing with mafia in Uttar Pradesh and other related events is attracting a lot of attention. ‘Rule of law’ is being discussed.
KEY TAKEAWAYS
Udit Misra Explains:
What is the rule of law?
— The notion behind the rule of law is to curb the exercise of arbitrary power by anyone. But, formally defining the rule of law can be much more onerous and can often lead to rather serpentine definitions.
— For the United Nations (UN), the rule of law “is a principle of governance in which all persons, institutions and entities, public and private, including the State itself, are accountable to laws that are publicly promulgated, equally enforced and independently adjudicated, and which are consistent with international human rights norms and standards”.
— The better approach is to outline what is expected when the rule of law prevails.
— The World Justice Project (WJP), which is an independent, multidisciplinary organization working to advance the rule of law worldwide, lays out four broad outcomes, as it were, if the rule of law prevails in a country. These are:
Accountability: Implying that the government as well as private actors are accountable under the law.
Just Law: Implying that the law is clear, publicised, and stable and is applied evenly. It ensures human rights as well as property, contract, and procedural rights.
Open Government: Implying that the processes by which the law is adopted, administered, adjudicated, and enforced are accessible, fair, and efficient.
Accessible and Impartial Justice: Implying that justice is delivered timely by competent, ethical, and independent representatives and neutrals who are accessible, have adequate resources, and reflect the makeup of the communities they serve.
How is the rule of law index created?
— Each year, the brings out a report ranking countries on the basis of the rule of law index. The index measures people’s perceptions and experiences of the rule of law in 140 countries and jurisdictions. The data featured in the 2022 report comes from global surveys completed by more than 154,000 households and 3,600 legal practitioners and experts
How is the index constructed?
— To build this index, the WJP looks at eight factors, which are further sub-divided into 44 sub-factors.
The eight main factors are as follows:
Constraints on government powers: This includes things like how effectively does the legislature or the judiciary deal with the government.
Absence of corruption: This essentially ascertains if public offices are being used for private gains.
Open Government: This includes things such as the right to information and laws and government data are well publicised.
Fundamental rights: This also includes whether the due process was followed.
Order and security: Whether crime is effectively controlled and civil conflict limited etc.
Regulatory enforcement: Things like whether regulations are effectively enforced etc.
Civil justice: Includes factors such as whether people can afford and access civil justice,
Criminal justice: Includes factors such as whether due procedures are followed etc.
The index values range between 0 and 1 with 1 being the score for complete adherence to the rule of law.
Why does the rule of law matter?
— Research shows that a stricter adherence to the rule of law is positively correlated to higher economic growth, better educational attainment, improved health outcomes, and greater peace among other benefits.
Where does India stand on the rule of law Index?
— India’s overall score in the 2022 report is 0.5 and its global rank is 77 out of 140 countries. Table 1 alongside captures how India performed on the various sub-categories. It is noteworthy that in 6 out of the 8 categories, India’s rank is lower than its overall rank.
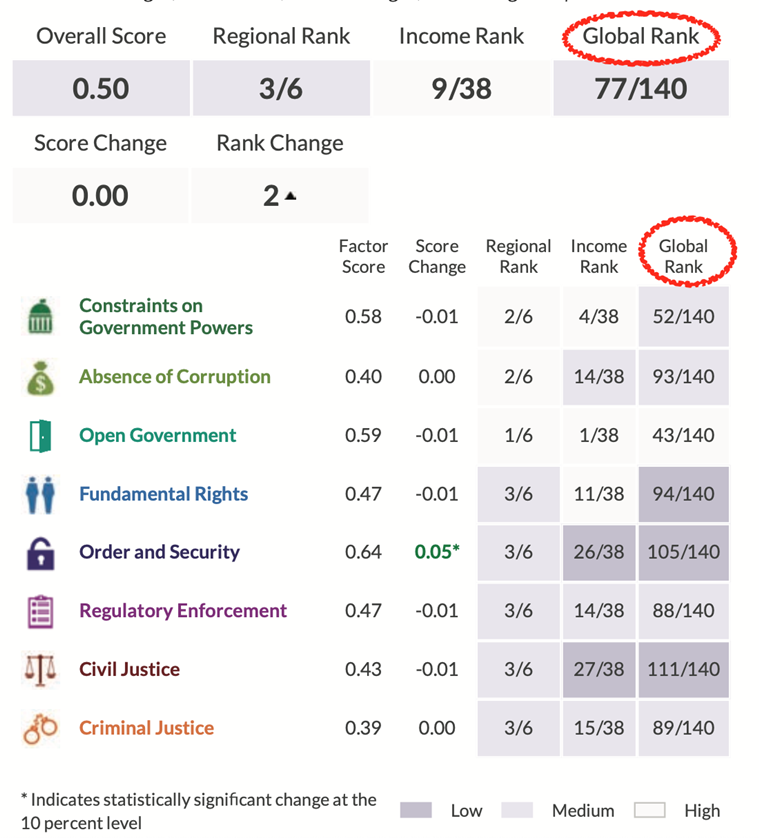
Table 1: India’s performance on rule of law index
— Even though India’s score hasn’t changed, it has moved up two places in the latest rankings. However, if one compares it to 2015, the score has fallen marginally from 0.51 to 0.50 while the rank has changed from being 59th out of the 102 countries ranked in 2015.
— Within the South Asia region, India is placed third, behind Nepal and Sri Lanka, out of six countries; Bangladesh, Pakistan and Afghanistan being the other three.
— Among the 38 countries that fall under the same income bracket — namely lower-middle income — India is ranked 9th. Countries such as Senegal, Ghana, Indonesia and Ukraine were ahead of India as of the 2022 report.
(Source: Should Thakur have killed Gabbar, and other questions triggered by the rule of law index by Udit Misra)
Point to ponder: Rule of law most fundamental feature of modern constitutions of world. Discuss.
1. MCQ:
Which of the following are regarded as the main features of the “Rule of Law”? (2018)
1. Limitation of powers
2. Equality before law
3. People’s responsibility to the Government
4. Liberty and civil rights
Select the correct answer using the code given below :
(a) 1 and 3 only
(b) 2 and 4 only
(c) 1, 2 and 4 only
(d) 1, 2, 3 and 4
WHY IN NEWS?
— More problems. More money. That is a key takeaway from the latest data published today by the Stockholm International Peace Research Institute (SIPRI), a leading global security think tank.
KEY TAKEAWAYS
Deutsche Welle writes:
— For 2022, researchers recorded a year-on-year jump of 3.7 per cent in worldwide military expenditure. That marks an all-time high and follows several years of continuously higher spending.
— For those who follow world events, the doubling down on defense likely comes as no surprise. Russia’s all-out war against Ukraine has particularly led European countries to pay their military budgets renewed attention. Ever since the first Russian missiles struck Ukrainian cities in February 2022, country after country has announced new spending.
Spending as a safety blanket
— Defense outlays among NATO members — the Euro-Atlantic military alliance incorporating most European countries — have been going up since at least 2014. That is when Russia initially attacked Ukraine, illegally annexing the Crimean Peninsula and backing separatists in the eastern part of the country. NATO members agreed to meet a defense spending goal of 2 per cent of national GDP by 2024, and many of them have been slowly working toward that target.
— The Russian threat that all this money is meant to counter, however, has not materialized as frightfully as first imagined. The fact that Ukraine has so far managed to counter the Russian forces, which are theoretically superior, and hem them into a corner of the country, casts serious doubt on a broader danger to the rest of Europe.
— Still, money for new military kit, and other defense-related spending, keeps pouring in. Russia may be a flop on the battlefield but it could still be a potent adversary in cyberspace. Infiltration of and attacks on digital infrastructure can be low-cost, but high-damage. And, of course, Russia maintains a considerable nuclear arsenal.
What the numbers mean
— A chicken-or-egg scenario has taken shape. As governments respond to a growing sense of unraveling security, they contribute to its further deterioration. At the same time, however, the SIPRI data shows that the spending spree may not be as pronounced as headlines and policymakers sometimes make it out to be.
— While actual spending is up, topping a combined $2.2 trillion (€2 trillion) in 2022, as a share of GDP it is 0.1 per cent lower than it was in 2013. That is despite double-digit increases over the past decade across many countries, including nuclear powers and those known for prioritizing armed forces, such as China (63 per cent), India (47 per cent), and Israel (26 per cent).
— In each of these countries, however, defense spending has declined as a percentage of national economic output.
— The discrepancy suggests economic expansion has outpaced national budgets in areas such as defense, even if dollar figures can appear eye-popping; and rapid, record inflation has forced governments to spend more just to keep up.
— In other words, they have lost purchasing power. A defense ministry faces similar price pressures when shopping for a squadron of fighter jets that a normal household does for buying a carton of eggs. Countries looking not just to maintain, but grow or upgrade their militaries, have to spend even more, which SIPRI’s reporting reflects.
— Inflation has also been a political problem, particularly in Germany, which early last year pledged an additional €100 billion for its armed forces in response to Russian aggression. After years of facing criticism for not spending enough, higher prices have muted its efforts to finally do so.
Not just bombs and bullets
— The additional sum, which comes on top of Germany’s regular defense budget, is not reflected in the SIPRI data because none of it was ready to be spent last year. Even when the funds do start flowing, Germany may still fall short of NATO’s goals, according to an analysis by the German Economic Institute at the end of last year.
— Earmarked for a five-year period, it’s a chunk of change intended to buy Germany new weapons and other equipment. The SIPRI figures, however, cover broader ground.
— National defense establishments are sprawling institutions, employing hundreds of thousands of civilian and military personnel, sometimes in far-flung and hostile regions, at great cost. These employees need to be fed and clothed, and have an administration to manage them.
— More spending, therefore, does not necessarily translate into more weapons and upgraded fighting forces. Although the arms industry is booming and under pressure to keep up with demand, defense ministries are also paying to keep the lights on and toilets clean, like in any office.
— The year-on-year increase also accounts for military aid, which has seen an exceptional increase due to Russia’s war in Ukraine. The United States alone has contributed more than $47 billion to Ukraine’s defense, according to the Kiel Institute, a German economic think tank.
— The portion of spending that does go directly to weapons varies by country, and it can be difficult to assess how effectively it is invested. That’s because there is a “lag effect,” SIPRI researcher Nan Tian explained.
— Weapon systems are large and complex and can take years to develop, procure, and press into service. Many of the aircraft, missile batteries, and armored vehicles considered top-of-the-line that Ukraine has pushed to receive from NATO members are decades old. Some of the latest spending, SIPRI notes, is going towards modernizing nuclear forces that most hope are never used.
— How much bang taxpayers get for their buck spent on defense is always a question when such huge sums of money are at play. That is especially the case for the US, which is by far the leader in military output. In 2022, the official US defense budget came in at $877 billion (€790 billion), according to the report. That accounts for 39% of global military expenditures.
— Taken as a percentage of national GDP, this defense spending may be less than it was in 2013 and a far cry from Cold War highs of nearly 10%, but no matter how you crunch the numbers it still enabled the US to project power and “spread that influence to the rest of the world.”
— China, which the US says is a major reason for increases to the defense budget, is a distant second, putting out $292 billion (€263 billion) last year. Despite the disparity between the world’s two largest economies, many US officials and security analysts are warning of China gaining a military edge.
— The extent to which that is true may have to do with where that money is spent. Whereas China is flexing its military muscle in its Pacific neighborhood, the US seems intent on maintaining a security footprint around the world — a position it has held since the Second World War.
On India
— Despite an 11 per cent drop in its arms import between 2013-17 and 2018-22, India remained the world’s largest arms importer from 2018 to 2022 followed by Saudi Arabia, according to the latest report by Stockholm International Peace Research Institute (SIPRI).
— The data released Monday showed Russia was India’s largest arms supplier in the periods between 2013-17 and 2018-22, but its share of arms imports to India fell from 64 per cent to 45 per cent while France emerged as the second-largest arms supplier to India between 2018-22 at 29 per cent, followed by the US at 11 per cent.
— The report said India’s tensions with Pakistan and China largely drive its demand for arms imports.
— “With an 11 percent share of total global arms imports, India was the world’s biggest importer of major arms in 2018–22, a position it has held for the period 1993–2022,” it said.
— However, it added that the 11 per cent drop in arms imports can be attributed to several factors including India’s slow and complex arms procurement process, and efforts to diversify its arms suppliers, among others.
— Aside from Russia and France, India also imported arms during this five-year period from Israel, South Korea, and South Africa which are among the top arms exporters globally.
— The report said Russia’s position as India’s main arms supplier is under pressure owing to strong competition from other supplier states, increased Indian arms production, and, since 2022, constraints on Russia’s arms exports related to its invasion of Ukraine.
— It also said just under two-thirds of Russian arms exports went to India, China, and Egypt in 2018-22 — at 31 per cent, 23 per cent, and 9.3 per cent, respectively. It said while Russian arms exports went down by 37 per cent between the two periods, exports to China and Egypt increased by 39 per cent and 44 per cent, respectively, within the same time frame.
— It, however, said that Russia made no deliveries to Egypt in 2021-22 and the volume of deliveries to China in 2020-22 was lower than in 2018-19. “It is likely that order volumes from these two states will reduce in the coming years,” it stated.
— India’s arms import from France, SIPRI said, included 62 combat aircraft and four submarines and increased by 489 per cent between 2013-17 and 2018-22.
“France therefore displaced the USA to become the second largest supplier to India in 2018-22,” the report said.
— As per the data, India was the third-largest arms supplier to Myanmar during this period after Russia and China and comprised 14 per cent of its imports. It also stated that 77 per cent of Pakistan’s arms supply in 2018-22 came from China.
(Sources: Military spending increases worldwide: What new SIPRI data says by Deutsche Welle; India remains world’s largest arms importer, share of Russian imports fell to 45 per cent: SIPRI data by Amrita Nayak Dutta)
Point to ponder: Expenditure on armed forces should not be viewed as burden on economy. Do you agree?
2. MCQ:
With reference to SIPRI data, consider the following statements:
1. US was India’s largest arms supplier in the periods between 2013-17 and 2018-22, but its share of arms imports to India fell from 64 per cent to 45 per cent while Russia emerged as the second-largest arms supplier to India between 2018-22 at 29 per cent, followed by the France at 11 per cent.
2. The report said India’s tensions with Pakistan and China largely drive its demand for arms imports.
Which of the above statements is/are correct?
(a) Only 1
(b) Only 2
(c) Both 1 and 2
(d) Neither 1 nor 2
WHY IN NEWS?
— There has been a consistent increase in government spending, coupled with declining out-of-pocket expenditure by people on their healthcare needs, shows the National Health Account Estimates 2019-20, which was released earlier this week. The government spent 1.35 per cent of the country’s Gross Domestic Product (total value of the final goods and services in a year indicative of a country’s economy) on healthcare during the year, bouncing back from a slight drop seen in 2018-19 as per the report.
KEY TAKEAWAYS
Anonna Dutt Explains:
— The health account estimates describe the country’s total expenditure on healthcare – whether by the government, private sector, NGOs, or individuals – and the flow of these funds. It answers questions such as what are the sources of healthcare expenditures, who manages the expenditures, who provides health care services, and which services are utilised.
What were the main findings of the report?
1. The government spending on healthcare has been on the rise. The money spent by the government on healthcare as a percentage of GDP has increased from 1.13 per cent in FY 2015 to 1.35 per cent in FY 2020. Even this small percentage increase in the government’s health kitty has translated into nearly double the money spent on each person – the per capita health spend of the government in this period has increased from Rs 1,108 to Rs 2,014.
Although the number is still far from the target of 2.5 per cent investment in healthcare by 2025, the number is likely to shoot up in next year’s report, with the increased government spending during the pandemic getting reflected.
The government’s share in the total money spent on healthcare in the country went up by a 12.4 percentage point between FY 2015 and FY 2020, increasing from 29 per cent to 41.4 per cent.
2. Money spent by people from their own pocket on healthcare has been going down. The report shows that 47.1 per cent of the total spending on healthcare in FY2020 came directly out of people’s pockets. But this is actually a 15.5 percentage point drop from 62.6 per cent of the spend coming out-of-pocket in FY 2015. The aim is to bring this down as low as possible by investing in public health and insurance among others so that people don’t have to shell out the money when they are sick.
3. A major chunk of the government’s health spend was in the primary sector. Out of the total spending by the government on healthcare in FY 2020, 55.9 per cent went to primary care, 29.6 per cent went to secondary care, and 6.4 per cent went to tertiary care. To compare, the government spent 51.3 per cent in primary care, 21.9 per cent in secondary care, and 14 per cent on tertiary care in FY 2015.
“It is heartening to see that there has been a consistent and fast increase in the government spending on primary healthcare. This is important because it forms the basis for preventive healthcare. This has been articulated in the National Health Policy that there will always be more spending on primary healthcare which is the backbone,” said NITI Aayog member (health) Dr VK Paul.
He added: “Now, there has been the great achievement of 1.5 lakh health and wellness centres across the country that can also screen people for cancers, diabetes, and eye disease.”
4. The union health secretary Rajesh Bhushan pointed out that there has been a consistent increase in social security expenditure by the government, which increased from 5.7 per cent of the total spending on health in FY 2015 to 9.3 per cent in FY 2020.
Why does the decline in out-of-pocket expenditure bother experts?
— The marginal increase in the government spending while there is a significant drop in out-of-pocket spending bothers Dr Indranil Mukhopadhyay, health economist and professor at school of government and public policy at OP Jindal University.
— He says: “First of all, the increase in government health expenditure as a percentage of GDP also takes into account capital spending (money spent on developing infrastructure). Other countries look at only the current health expenditure, which for India stands at 1.04 per cent calculated based on this report. This puts India in 164th place out of 184 countries in terms of government health spending. Also, the marginal increase in percentage could be a factor of a shrinking economy – GDP growth was slow in FY 2020. In fact, this percentage is likely to go up further next year because the economy tanked as a result of Covid-19.”
What is the reason for steadily dropping out-of-pocket expenditure?
— “If you look at the total spending on health (which includes health spend by government, private players and individuals) it has been going down as a proportion of GDP – from 3.9 per cent in FY 2015 to 3.3 per cent in FY 2020. This means that there is a decline in consumption of healthcare services. And, our work with NSSO data supports this as we saw a decline in hospitalisations and out-patient services. This is inexplicable!” says Mukhopadhyay.
— He says that while the data might be hiding these facts, the government’s initiatives are on the right track to ensure that people’s expenses on health go down. Health and Wellness Centres ensuring preventive care and Ayushman Bharat insurance scheme offering free treatment is the way to go, “but the implementation has to be strengthened so the poor people can actually access care,” he said. The out-of-pocket expenditure can also be reduced by improvement in procurement of medicines that make a significant proportion of health costs and improving services in the public sector hospitals too.
Has there been an increase in spending on insurance?
— Along with an increase in government spending, the report shows that there has been an increase in spending on privately purchased health insurance as well. Privately purchased health insurance made up for only 3.9 per cent of the total health expenditure in FY 2015, which increased to 7.72 per cent in FY 2020. The government financed health insurance spending also went up from 3.8 per cent of the total money spent on healthcare in FY 2015 to 6.37 per cent in FY 2020 as per the report.
— Dr Paul said that increase in purchase of private insurance was an encouraging trend indicating that people accepted this as a way forward, supplementing the government’s spending on healthcare. “The national regulator is also working on developing better products that people from the middle class and upper middle class would happily buy. This would increase the basket,” said Dr Paul.
Has health spending by states gone up?
— Dr Paul said that the data from the detailed report could be meaningfully used by the states to design their policy and budget. He said that there was a need for the states to increase their contribution towards healthcare and achieve the target set by the National Health Policy 2017, which says that 8 per cent of states’ budget should go towards healthcare.
— “Right now except for one or two states, the target of 8% hasn’t been achieved. Most stand at 4.5 per cent to 5 per cent of their budget,” said Dr Paul.
— Only two big states and three of the smaller ones have crossed the 8 per cent target in FY 2020 – Delhi (contributing 18.7 per cent of its total spending on health), Kerala (8 per cent), Puducherry (10.5 per cent), Meghalaya (8.9 per cent), and Goa (8.7 per cent), according to the report.
— Dr Mukhopadhyay added: “With health being a state subject, much of the government spending comes from the states. And, there is a need for the Centre to provide more support to states that demand it. At present, the government schemes force the states to spend by giving them a percentage from the Centre for the implementation of a scheme. However, if a state decides to implement a scheme, they need to be supported by Centre. Take for example, Rajasthan trying to implement the right to health bill, the Centre should encourage such efforts and give them additional funds.”
(Source: What the latest National Health Account figures say about India’s healthcare sector by Anonna Dutt)
Point to ponder: National Health Accounts figure should be correlated with other data for meaningful policy interventions. Discuss.
3. MCQ:
With reference to National Health Account Estimates 2019-20, consider the following statements:
1. There has been a consistent increase in government spending, coupled with increasing out-of-pocket expenditure by people on their healthcare needs.
2. A major chunk of the government’s health spend was in the primary sector.
3. The health account estimates describe the country’s total expenditure on healthcare by the government only and not private sector, NGO or individuals.
Which of the above statements is/are correct?
(a) 2 only
(b) 3 only
(c) 1 and 2 only
(d) 1 and 3 only
WHY IN NEWS?
Read UPSC Magazine