© The Indian Express Pvt Ltd

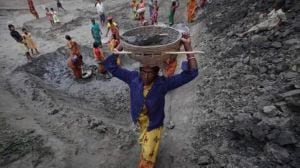
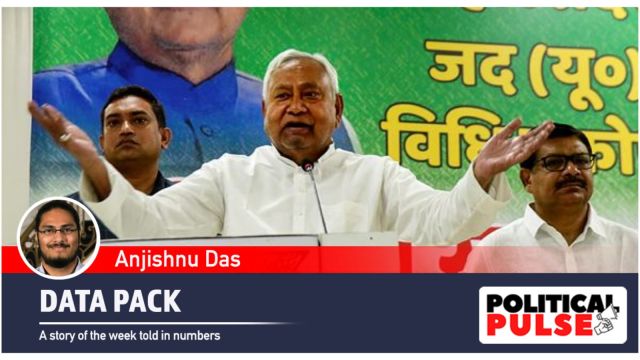 The Nitish Kumar-led NDA government and the principal Opposition Rashtriya Janata Dal (RJD) have often engaged in “credit wars” for job-creation initiatives. (PTI)
In Bihar, unemployment, poverty and migration have been perennial election issues. With the state heading to the Assembly polls in October-November this year, major parties have again started building up their campaign on these issues.
The Nitish Kumar-led NDA government and the principal Opposition Rashtriya Janata Dal (RJD) have often engaged in “credit wars” for job-creation initiatives, going back to their days in the Mahagathbandhan government before Chief Minister Nitish Kumar, the JD(U) chief, returned to the NDA fold in January 2024.
Last month, the Congress, which is a key constituent of the RJD-led Mahagathbandhan, launched a “Palayan Roko, Naukri Do (stop migration, give jobs)” yatra, while the BJP, senior ally of the JD(U), made special efforts with its nine-day Bihar Diwas celebrations to reach out to the Bihari migrants across the country.
The 2011 Census data shows that migration and unemployment are closely linked. Bihar was second only to Uttar Pradesh in terms of the number of migrants spread across the country, including for those who moved to other states for employment.
In total, there were 74.54 lakh migrants from Bihar across 34 states and UTs, as per the 2011 Census data. Only UP, at 1.23 crore, had a larger out-migrant population than Bihar. India has a total 5.43 crore inter-state migrants, accounting for 4.5% of the country’s population. As a proportion, Bihar’s out-migrants count for 7.2% of the state’s population.
At 13.36 lakh, Jharkhand was the top destination for migrants from Bihar, followed by Delhi at 11.07 lakh, West Bengal at 11.04 lakh, UP at 10.73 lakh, and Maharashtra at 5.69 lakh.
 [MAP: State-wise population of migrants from Bihar]
Four of the top 10 migration corridors across the country included Bihar as the source state, while there were eight such corridors involving Bihar in the top 50. The most popular migration corridor was from UP to Delhi at 28.5 lakh.
Of Bihar’s 74.54 lakh out-migrants, 22.65 lakh or 30% said employment was the reason for migration, making it the most cited justification followed by moving with their household at 26.6% and marriage at 24.4%. While work is the primary reason for men to migrate, it is marriage for women. Nationally, 23% of all migrants cited employment as the reason for migration. Again, only UP at 37.35 lakh had more out-migrants who moved for employment.
 [TABLE: Reasons for migration]In the 2001 Census too, UP and Bihar stood at number one and two positions in the country, respectively, in the number of migrants originating from the states. Delhi was then the top destination for migrants from Bihar, followed by UP, Maharashtra, Punjab and Haryana. Then too, the top reason for migration was employment, and Bihar had the second-largest number of such out-migrants.
While the Census data on migration is now over a decade out of date, there are some more recent measures of migration.
For instance, the 2016-17 Economic Survey of India used a Cohort-based Migration Metric (CMM) to gauge net migration as the percentage change in population between the 10-19 year-old cohort in an initial census period and the 20-29 year-old cohort in the same area a decade later. “It is likely to capture labour migration, as other bilateral movements for reasons such as marriage are netted out in the equation,” the report says.
The 2016-17 Economic Survey data shows that UP and Bihar have the highest such net migration which has increased between 1991-2001 and 2001-11. While Bihar saw 11.35 lakh people aged 20-29 years leave the state in 1991-2001, this figure rose to 26.95 lakh in 2001-11.
Last December, a study by the Economic Advisory Council to the Prime Minister (EAC-PM) measured the number of passengers travelling using unreserved or general tickets, which are among the cheapest available, as a proxy for blue collar migrants.
The EAC-PM report used 2023 data to show that UP, Maharashtra, West Bengal, Rajasthan and Madhya Pradesh were the most popular destinations for such passengers. Bihar was the origin state for four of the 10 most popular state-to-state routes with the top destinations for Bihar migrants being Delhi, West Bengal, UP and Maharashtra – a pattern that mirrors those in the 2011 Census.
A 2024 report published by the International Labour Organisation (ILO) and the Delhi-based Institute for Human Development found that in 2021, 39% of Bihar’s migrants cited employment as the reason for leaving the state, which ranked last in India on the “employment condition index” that measures the quality of employment, including metrics like wages, formal versus casual work, and youth employment. This report also shows that Bihar ranked last when it came to employment levels for educated youth aged 15 to 29 years.
Underlying the volume of out-migration from Bihar is the state of its economy, and persistently high levels of poverty and unemployment.
Bihar’s Economic Survey for 2024-25 shows that the state is still heavily reliant on the primary sector (that is, the extraction of raw materials including agriculture) for employment. Though the primary sector only contributed to 19.9% of the state’s economic output in 2023-24, it accounted for 54.2% of employment – both figures are above the national average of 16.6% and 46.3% respectively.
As per Bihar’s Economic Survey, the secondary sector, which includes manufacturing and construction, accounted for 21.5% of the economic output and 23.6% of employment in 2023-24. Though the tertiary sector, which includes services, contributed to 58.6% of the economic output in 2023-24, it only employed 22.2% of the workforce.
A comparison of Bihar’s per capita income with the national average shows that the state has consistently lagged behind. Since 2011-12, Bihar has had the lowest per capita income, which stood at Rs 32,174 per year in 2023-24 compared to the national average of Rs 1.07 lakh.
 [CHART: Per capita income, Bihar vs national average]Data from the NITI Aayog’s Multidimensional Poverty Index – which measures poverty as a composite of several indicators including income, health, education and other standards of living – found that poverty fell in Bihar from 51.89% of its population in 2015-16 to 33.76% in 2019-21. However, despite the decline, Bihar has the highest rate of multidimensional poverty in the country.
The 2023-24 Household Consumption Expenditure Survey, which measures the spending capacities and patterns of households, shows that a rural household in Bihar spends an average Rs 3,788 per month, while an urban household in the state spends Rs 5,165, while taking into consideration the value of free or subsidised goods received through government welfare schemes. Both these figures are well below the national average of Rs 4,247 (rural) and Rs 7,078 (urban).
Bihar’s labour force participation and unemployment rates paint a worrying picture, particularly for the youth. The Periodic Labour Force Survey (PLFS) for July-September 2024, which contains data only for urban areas, put Bihar’s labour force participation rate (a measure of the share of the working age population that is actively working or seeking work) for those aged above 15 years at 40.6% and for those aged 15-29 years at 24.7%. Bihar ranks as the worst state in India on these metrics.
For the same period in the PLFS, Bihar’s unemployment rate for those aged above 15 stood at 7.3%, which is above the national average of 6.4% but below a number of states including Chhattisgarh, Kerala, Odisha and Jammu and Kashmir. But for those aged 15-29 years, the unemployment rate was 23.2% – well above the national average of 15.9%, and the sixth worst among the states.