On Wednesday, the Ministry of Statistics and Programme Implementation (MoSPI) released India’s economic growth data for the second quarter of the current financial year (2022-23 or FY23). The second quarter or Q2 refers to the months of July, August and September. India’s gross domestic product or GDP grew by 6.3 per cent in Q2 on a year-on-year basis. In other words, it was 6.3% more than the GDP in the same months in 2021. MoSPI also reported that India’s Gross Value Added (or GVA) in Q2 grew by. 5.6 per cent on a year-on-year basis.
GDP and GVA are the two main ways to ascertain the country’s economic performance.

Both are measures of national income.
The GDP measures the monetary measure of all “final” goods and services— those that are bought by the final user— produced in a country in a given period.
The GDP does this by adding up the total expenditures in the economy; in other words, it looks at who spent how much. That is why GDP captures the total “demand” in the economy.
ExplainedH2 growth prospects dim
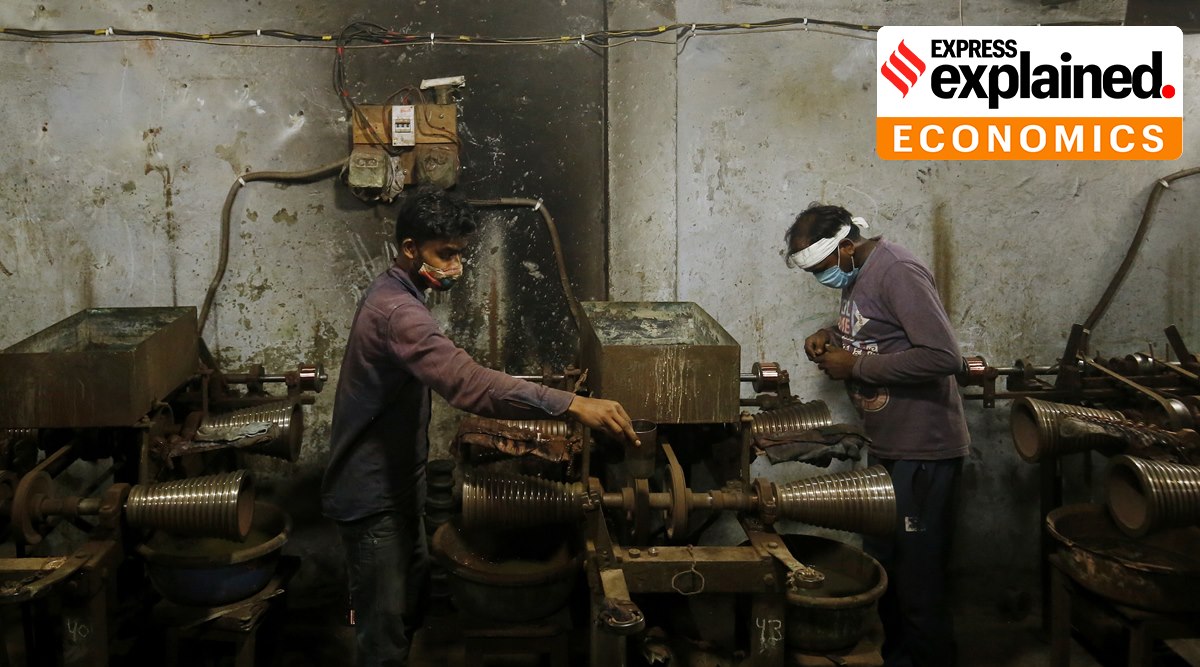
The economy has picked momentum since the pandemic, but the contraction in the manufacturing sector put a question mark on demand going forward. Higher interest rates and no sharp pick-up in consumption in the backdrop of a slowing global economy will pose challenges in the second half of the current financial year.
Broadly speaking there are four key “engines of GDP growth”. These are
*All the money Indians spent for their private consumption (that is, Private Final Consumption Expenditure or PFCE)
* All the money the government spent on its current consumption, such as salaries [Government Final Consumption Expenditure or GFCE]
Story continues below this ad
* All the money spent towards investments to boost the productive capacity of the economy. This includes business firms investing in factories or the governments building roads and bridges [Gross Fixed Capital Expenditure]
* The net effect of exports (what foreigners spent on our goods) and imports (what Indians spent on foreign goods) [Net Exports or NX].
The GVA calculates the same national income from the supply side. It does so by adding up all the value added across different sectors. According to the RBI, the GVA of a sector is defined as the value of output minus the value of its intermediary inputs. This “value added” is shared among the primary factors of production, labour and capital.
By looking at the GVA growth one can understand which sector of the economy is robust and which is struggling.
Story continues below this ad
How are the two related?
When one is looking at quarterly data, it is best to look at GVA data because it is this which is the observed data. The GDP is derived by looking at the GVA data.
The GDP and GVA are related by the following equation: GDP = (GVA) + (Taxes earned by the government) — (Subsidies provided by the government)
As such, if the taxes earned by the government are more than the subsidies it provides, the GDP will be higher than GVA. Typically, that is how it is. For the second quarter too, the GDP (at Rs 38,16,578 crore) is much higher than the GVA (which is at Rs 35,05,599 crore).
Story continues below this ad
The GDP data is more useful when looking at annual economic growth and when one wants to compare the economic growth of a country either with its growth in the past or with another country.
What does the GVA data show?
The biggest news in GVA data is the contraction in the manufacturing sector. In Q2, manufacturing GVA declined by 4.3%. This is significant because manufacturing carries a huge potential for job creation and can soak up excess labour from the agriculture sector. The contraction has meant that manufacturing GVA has grown by just 6.3 per cent over the three years since the Covid pandemic; look at the change between FY23 and FY20 in the CHART.
However, it would be a mistake to believe that only Covid and its after-effects are responsible for the lacklustre manufacturing performance.
The fact is, as borne by the data, manufacturing GVA grew by just 10.6% between FY17 and FY20. For perspective, it is important to remember that between FY14 and FY17, manufacturing GVA grew by 31.3%. In other words, Indian manufacturing has been struggling to add value for the past six years. This would explain why data from the Centre for Monitoring Indian Economy (CMIE) shows that jobs in the manufacturing sector halved between 2016 and 2020.
Story continues below this ad
The other big story is the almost 15 per cent growth in services such as trade and hotels, etc. This is also a huge sector for job creation. But again, if one looks at the Q2FY23 level and compares it to the pre-Covid level (Q2 of FY20), the growth is barely over 2 per cent. That this sector grew by over 26 per cent in the three years between FY17 and FY20 — when India was experiencing a serious economic deceleration — shows how badly it has been affected by the Covid disruption.
Another sector crucial for job creation, even though it is smaller in terms of overall contribution to India’s GVA, is mining and quarrying. It, too, has contracted by almost 3%. Looking back over the past six years, it has contracted by 3.5% between FY17 and FY20 and grown by just 2.5% since then.
One positive story emerging from the GVA pertains to agriculture (along with forestry and fishing), which has done better than expected by growing at 4.6%. Typically, this is a good growth rate for this sector and has happened despite some worries that the sowing of crops did not happen in time.
Overall, while the GVA has grown by 5.6 per cent year on year, the growth is just 7.6 per cent when compared to the pre-Covid level set in FY20.
Story continues below this ad
What does GDP data show?
On the GDP side, the biggest engine of growth is private consumption expenditure. It typically contributes over 55% of India’s total GDP. This component is also crucial because if this is depressed, it robs businesses of any incentive to make fresh investments; and expenditures towards investments are the second biggest contributor to the GDP, accounting for around 33 per cent of the total.
Data shows that private consumption has grown by a healthy 9.7 per cent over the past year. However, the growth is relatively modest — just 11 per cent — when compared over the last three years. That between FY14 and FY17, this component grew by almost 28% provides some perspective.
The investment expenditures have grown by 10.4% over FY21 and by almost 21% between FY20 and FY23. This is the best growth over any three-year period going back to FY14. This suggests brighter prospects for the economy over the medium term.
The biggest surprise though from the GDP is the contraction in government final consumption expenditures. While these types of expenditures account for just about 10-11% of the GDP, they have the ability to prop up an economy during tough times when people and businesses hold back spending. Oddly enough, data shows that not only did government consumption expenditure contract by 4.4% per cent in Q2 (over the Q2 of 2021), but that it is almost 20% below the pre-Covid level.
Story continues below this ad
The last component of the GDP equation is the Net Exports data. Typically, since India imports far more than it exports, the NX value is negative. In Q2, this negative value swelled by 89 per cent. Over the past three years, this drag on GDP has also increased in size by almost 150 per cent.

 Source: RBI, MoSPI