Udit Misra is Senior Associate Editor. Follow him on Twitter @ieuditmisra ... Read More
© The Indian Express Pvt Ltd
Latest Comment
Post Comment
Read Comments
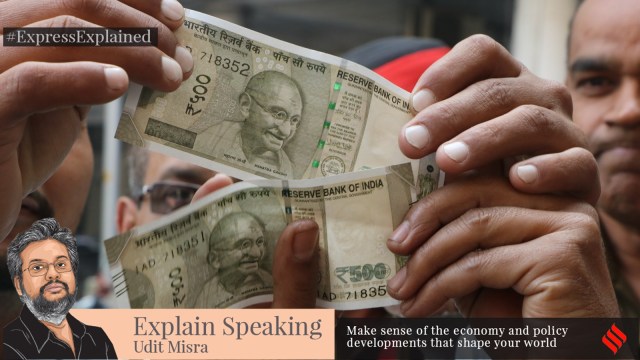
 A man showing the 500 rupee note in Sector 17, Chandigarh on November 18, 2016. (Express photo by Kamleshwar Singh)
Dear Readers,
Later on this week (on Friday), the Ministry of Statistics and Programme Implementation will release the data for retail inflation in the month of December. Retail inflation is also called the consumer price inflation — i.e. the price rise that consumers have to deal with.
It is also important to note that inflation in this context refers to increase in the general price level — not the increase in the price of any one commodity.
Equally important is to understand that inflation rate is the rate at which prices rise. In other words, an inflation rate of 5% implies that the price level is 5% higher than what it was in the previous period.
Retail inflation data is critical to policymaking because it is this measure of inflation that India’s central bank (the Reserve Bank of India) takes into account when it decides whether to raise or cut interest rates in the economy. Read this piece to know more.
RBI’s action, in turn, affects what EMIs you pay for your car/home loan and for how long.
What’s likely to happen?
CHART 1 shows the trajectory of inflation over the past five years. The blue horizontal line corresponds to the 4% inflation rate — the RBI’s target rate. The red horizontal line is the upper limit of RBI’s comfort zone.
 Chart 1
The data shows that after staying above RBI’s comfort zone for most of 2022, retail inflation rate did moderate during 2023.
But in November, it started going in the wrong direction yet again.
According to a research note in the Economic Outlook by Centre for Monitoring Indian Economy (CMIE), December’s retail inflation is likely to cross the 6% threshold yet again.
If that happens, it is likely to singe hopes of an early reversal of the tough monetary stance that RBI has maintained since May 2022. In other words, EMIs are likely to stay higher for longer.
For the full financial year (2023-24), the CMIE estimates the inflation rate to be around 5.5%.
It is also noteworthy that inflation would have remained higher than RBI’s target rate for the whole of the second-term under Prime Minister Modi.
How well are you in ‘real’ terms?
But beyond what the inflation rate will do to future policymaking, there is another good reason why you should want to know what is happening to it: It is to understand whether you are economically better or worse off in “real” terms (from, say, five years ago). The term “real” refers to one’s economic state when the effect of inflation is taken away.
To be sure, if the inflation rate went up by 4% in each of the past 5 years, it would essentially mean that the general price level in the economy went up by around 22%. The second column in the TABLE 1 alongside will give you a better sense. If inflation went up by 6% each year (See the third column) then, by the fifth year, the general price level would have gone up by 34%.
 TABLE 1 inflation index
At a 4% annual inflation rate — which is what the RBI hopes to maintain more often than not — the general price level in the economy will double in around 18 years. At 6% inflation rate, the price level becomes twice as high in just around 12 years.
The way this calculation works is to peg the general price level at the 100 mark. A 4% increase in overall prices each year implies that whatever you could buy for Rs 100 in the base year costs Rs 104 in first year, Rs 108 in the second (Rs 108 and 16 paise to be exact), so on and so forth until it costs roughly Rs 122 in the fifth year.
In other words, if your income or salary hasn’t grown by 22% in the five years, then you will find yourself economically weaker in “real” terms. That’s because your current day salary is not good enough to buy the same basket of goods it bought five years ago.
Even if your salary has gone up by 22%, you would be at the same level in “real” terms as you were five years ago.
Since we have now entered the election year, it is a valid question to ask if people are better off or worse. The answer requires looking at both inflation and the increase in one’s income levels.
So, how did inflation rise during the Modi years?
The TABLE 2 provides a rough sense of affordability during the past two terms of government under Prime Minister Modi.
 TABLE 2 inflation index
In the first five year term, prices rose by 24% — index touching 124 mark if one compares to the price level at the start of the term. In the second term, however, prices have gone up by 32%.
Over the full 10-year period, the general price level has risen by 64%.
To understand whether you are better off or worse (and by how much) from where you were five or 10 years ago, you don’t need any elaborate nationwide survey.
Just do a rough calculation:
> Has your salary increased by more than 32% since the start of 2019?
> Has it increased by more than 64% since 2014?
Until next time,
Udit