© The Indian Express Pvt Ltd

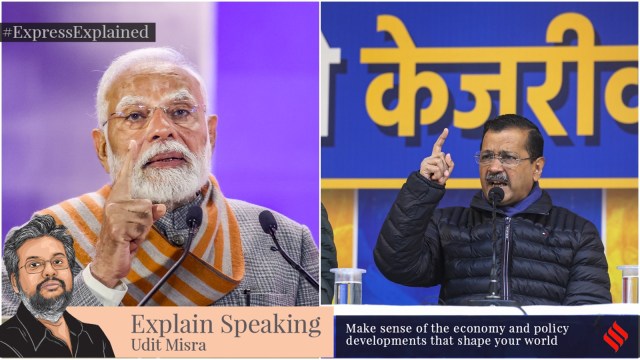 Notwithstanding its spectacular electoral popularity under PM Modi, the BJP has failed to dislodge Kejriwal's AAP from the national capital. (Photos: PTI)
As you know, Delhi will go to Assembly polls in early February. It is noteworthy that the incumbent party, the Aam Aadmi Party (AAP), has been in power since 2014. That was also the year Prime Minister Narendra Modi led BJP to power in the Centre. However, notwithstanding either the BJP’s spectacular electoral popularity under PM Modi or Arvind Kejriwal-led AAP’s absolute inexperience in the political and governance arena, the BJP has failed to dislodge the AAP from the national capital.
Indeed, there are very few states where the BJP has failed to dislodge the incumbent government in the course of the past decade. In most cases, a key element of the BJP’s electoral pitch has been that a state’s voters would benefit from choosing the BJP in Assembly elections because of what PM Modi calls the “double engine sarkaar (government)” — that is, a state would be better off with a BJP government both in the state as well as the Centre. In most state elections where BJP was a credible contender, this argument seemed to have held sway.
The only times in the past decade when the BJP has failed to win this argument is when it has gone against the AAP in Delhi, the Mamata Banerjee-led All India Trinamool Congress in West Bengal, and the Nitish Kumar-led Mahagathbandhan in Bihar. It is noteworthy that the BJP’s other potent criticism — of dynastic rule in political parties — does not apply to either of these three leaders. Of course, Kumar is now part of the BJP-led National Democratic Front.
The question is: Has Delhi under AAP done better than the double-engine sarkaar of BJP-ruled states?
What about other states with, for argument’s sake, single engines? What about states where the BJP was not a credible alternative at the state level?
There is no single variable or indeed even a set of variables that can conclusively answer these questions. However, the Reserve Bank of India’s Handbook of Statistics for Indian States (an annual publication), which was released in December, provides an opportunity to look at how different states performed between 2014-15 (FY 15) and 2023-24 (FY24) on some of the key macroeconomic variables. This week’s ExplainSpeaking attempts to provide a snapshot.
The variables chosen try to gauge include:
— the economic performance (per capita economic output of the state, inflation, unemployment and employment rates)
— the fiscal health of the government (fiscal deficit or borrowings by the government as well as the level of outstanding liabilities)
— the expenditure priorities of the government (how much do they spend on building physical infrastructure as against spending on education, health and family welfare)
— the welfare of a state’s residents (poverty rate and per capita availability of electricity).
The states chosen for this comparison include, apart from Delhi,
— Gujarat and Haryana (to represent the double-engine BJP governments between 2014 and 2024. Gujarat is the ultimate example of this argument. Haryana provides a further contrast as it is contiguous to Delhi.
— West Bengal, where the BJP failed to dislodge the incumbent
— Bihar as an example of a state with a uniquely mixed record where BJP has been in and out of the government at different times.
— Tamil Nadu, as an example of a state where BJP was not in direct contention of governance in any way at least in the past decade.
In choosing the variables and states, the attempt was to get as much variation as possible and also have the state level data for all the years.
 Express Graphic: Abhishek Mitra
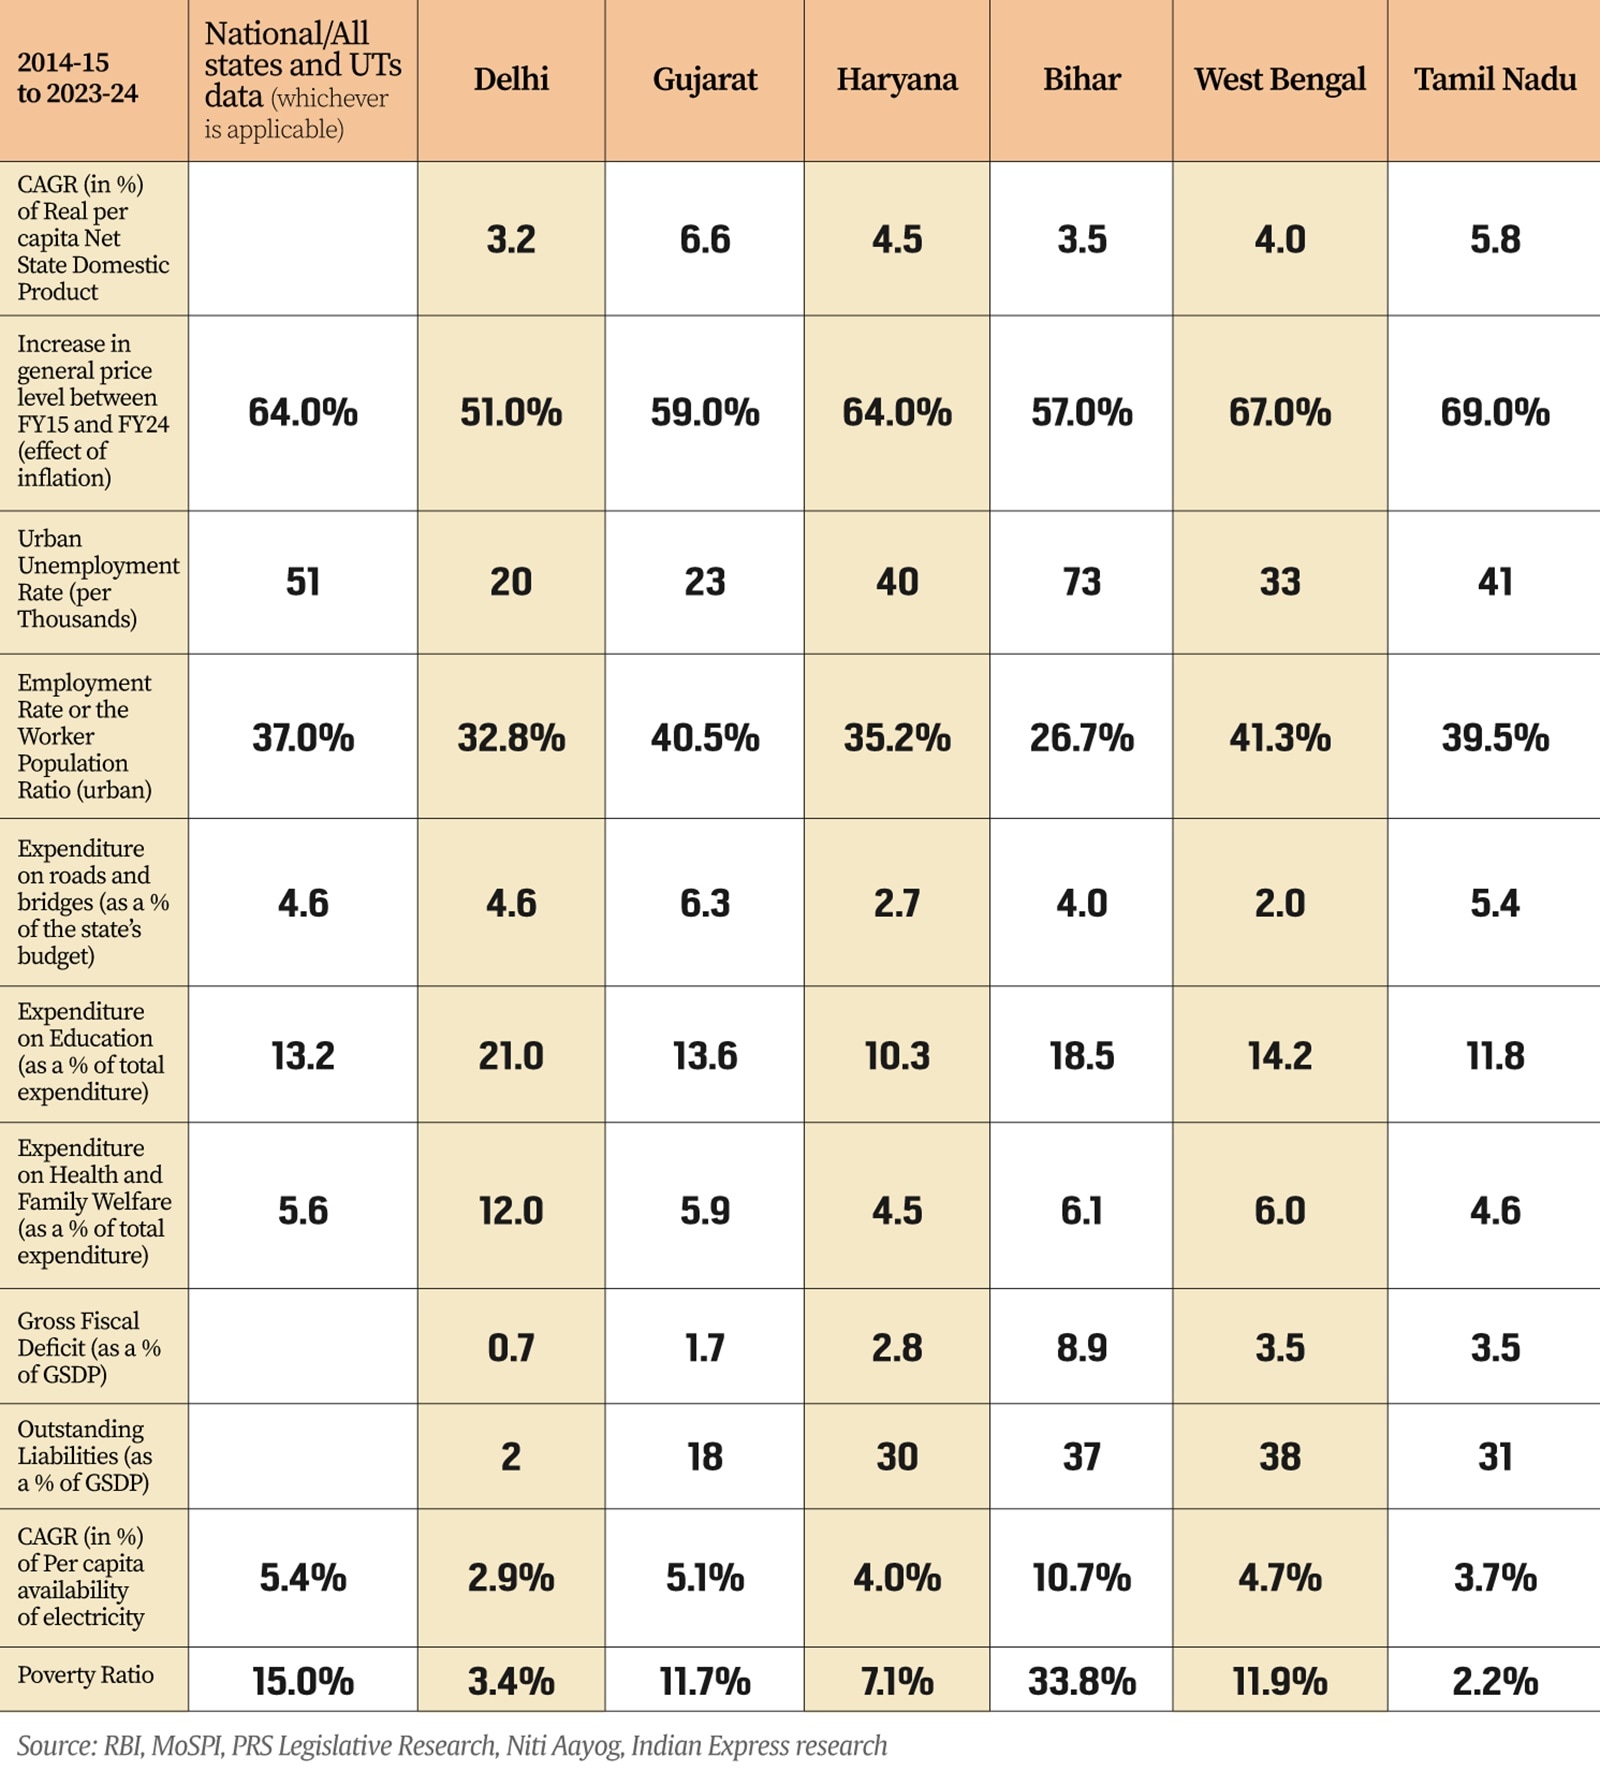
The Table alongside summarises the results. Apart from RBI Handbook, data is sourced from Period Labour Force Survey, PRS Legislative Research, and RBI’s study of State Budgets.
The AAP’s record is the poorest in this selection of states. Per capita state output (the size of the state’s economy after taking into account the population) grew at a paltry rate of 3.2% annually between 2014 and 2024. The BJP led Gujarat clocked an annual (compounded annual growth rate or CAGR) growth rate twice as fast at 6.6%. West Bengal, another single-engine state, too, lagged behind on growth rate.
Increase in general price level due to inflation
Inflation rate for any year essentially shows how much the general price level (based on a representative basket of consumer goods) went up in a particular year. As the years roll by, the general price level keeps rising, even when inflation rate has moderated. The net increase in the price level tells us about the affordability of goods and services.
Here, the tables are turned and AAP’s record is possibly the best in the country.
In Delhi, the general price level went up by 51% over the past decade — that is, to say a basket of goods that cost Rs 100 in 2014, cost Rs 151 in 2024 . However, this rate is much lower than the national average of 64% and the others in this selection of states. Tamil Nadu experienced the highest cumulative inflation.
Urban unemployment rate
On unemployment rate — which is the percentage of people who are asking for a job and not getting it — it is possible to only compare urban data because there is no rural data for Delhi. The national average is 51 unemployed per thousand. Delhi stands at 20 — much lower than the national average and lowest in this group of states. Neighbouring Haryana stands at double the rate. Bihar clocks the highest urban unemployment.
Urban employment rate
Often in India, the number of people asking for a job falls — such as during the Covid lockdown or because people are just tired of looking for a job. As such, more than unemployment rate, it is the employment rate that captures the labour stress. Employment rate is also called the Worker Population Ratio — or the percentage of workers in the population. A higher rate is better. On this count the picture changes. Delhi’s employment rate is lower than the national average and only better than Bihar’s in this selection. However, West Bengal, another single engine state, is ahead of this pack.
Budget expenditure on roads and bridges
Since 2014 and more particularly since 2019, there has been a massive focus on ramping up physical infrastructure in the form of roads and bridges. The argument is that such investments by the government will improve the productive capacity of the country. While Delhi matches the national average of all states and UTs, it is Gujarat that leads expenditure on this count as a percentage of the state budget. But states such as Haryana and West Bengal lag far behind.
Budget expenditure on education
It has been a long-standing criticism that governments in India do not spend enough on education and health. Delhi under AAP has ramped up expenditure (as a percentage of total) towards education. As of the Revised Estimates of 2023, it stood at 21% as against a national average of 13% and far higher than the neighbour Haryana at 10%.
Budget expenditure on health and family welfare
On health, too, it is AAP’s Delhi that leads with 12% of its total expenditure as against just 5.6% of national average. In percentage terms then, Delhi spends three-times more on health than neighbouring Haryana and two-times more on education.
Government’s borrowings (gross fiscal deficit)
Does that mean Delhi has a higher fiscal deficit? The fiscal deficit refers to the amount of money a state government has to borrow to meet the gap between its expenses and its income in a particular year. Prudential norms require fiscal deficit to be within 3% of the state’s GDP. Delhi’s fiscal deficit in FY23 was just 0.7% — the lowest in this comparison. Gujarat and Haryana also stay within the prudential norms, albeit higher than Delhi. Bihar had the highest fiscal deficit at least at the end of FY23.
Government’s outstanding liabilities
While fiscal deficits show the borrowing for one particular year, the outstanding liabilities refer to the debt accumulated by states from borrowings in the past. On this, AAP’s Delhi stretches its lead much further away from the rest of the pack. West Bengal and Bihar have the highest level of outstanding liabilities.
Per capita availability of electricity
Per capita availability of power is a good way to capture how a state’s economy is improving. Data shows that just like the per capita real GDP, AAP-governed Delhi has seen a fairly feeble year on year growth (CAGR) of 2.9% over the past decade. Bihar has grown by almost four-times the pace. Gujarat clocked a rate below the national average yet it is noteworthy that it started the decade behind Delhi — 1465 kilowatt-hour to Delhi’s 1599 — but rapidly took over to finish far ahead of Delhi — 2414 KwH to Delhi’s 2118 KwH.
Poverty ratio
In 2023, Niti Aayog provided the latest update on the Multidimensional Poverty Index. RBI used that data along with National Family Health Survey data to provide the headcount ratio of poverty in each state. All states brought down poverty ratios but Delhi, which had just 4.4% poverty in 2015-16 had brought it down to 3.4%, and was only behind Tamil Nadu (just 2.2% poverty) in this list. Bihar, which had 55% poverty in 2015, still has over 33% poverty ratio.
UPSHOT
Where AAP’s single-engine raced ahead
There is clearly a pattern in the way AAP’s Delhi has governed. The government has become a benchmark in terms of budgetary spending on education (includes sports and arts) and health while still being the most fiscally responsible government. It has also been the most effective in containing inflation, which hits the common man the most.
Where AAP’s single-Engine lagged behind
However, when it comes to the overall pace of economic output or spending on physical infrastructure or improving the availability of electricity, the AAP’s engine seems to have run out of steam.
How do you rate AAP’s record? Should it change its approach to governance? Share you views and queries at udit.misra@expressindia.com
Cheers!
Udit