© The Indian Express Pvt Ltd

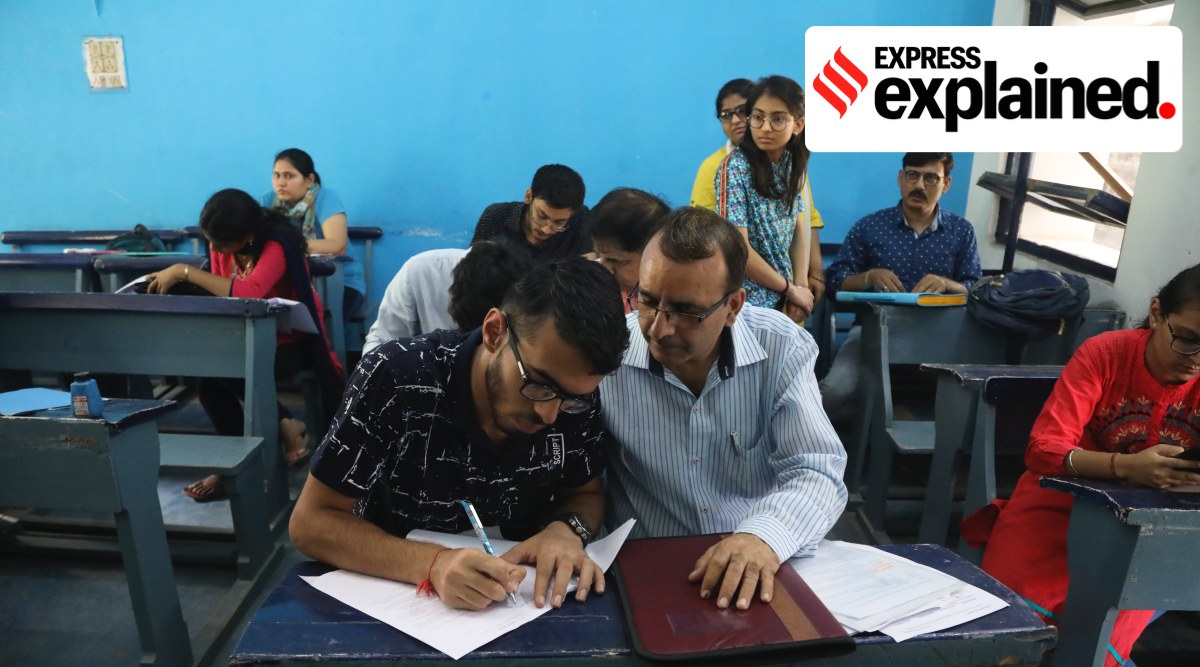 Students fill forms for admission at Ramjas College in Delhi University. (Express Photo: Abhinav Saha, File)
From the academic session 2022-23, admission to undergraduate programmes in all 45 central universities in the country will take place through a common entrance test. Given the pool of undergraduate students in the country — over 3 crore were enrolled in various higher education institutes in 2019-20 — the move will have a wide impact on how they get into central universities, especially those that relied on Board marks.
On Tuesday, the University Grants Commission (UGC) issued a public notice on the proposed Common University Entrance Test (CUET), for which application forms will be available in the first week of April. Even state, private and deemed-to-be universities are free to adopt the CUET, which will be conducted in 13 languages: Hindi, Marathi, Gujarati, Tamil, Telugu, Kannada, Malayalam, Urdu, Assamese, Bengali, Punjabi, Odia and English.
A look at the scale of India’s undergraduate level education in terms of enrolment, institutions and courses:
According to the All India Survey of Higher Education (AISHE) 2019-20, out of 3.85 crore students enrolled in all levels of higher education in India, 3.06 crore, or 79.5%, were at the undergraduate level, followed by postgraduate, with 43.1 lakh students or 11.2% (Chart 1).
 Source: AISHE 2019-20
For now, admissions to postgraduate courses are not mandated to be held under any common entrance.
Enrolment has been growing over the years. At undergraduate level, it has risen from 2.74 crore in 2015-16 to 3.06 crore in 2019-20, and at PG level, from 39 lakh to 43 lakh. (Chart 2 shows growth across levels.) The next AISHE report is likely to capture the impact of the pandemic on enrolment.
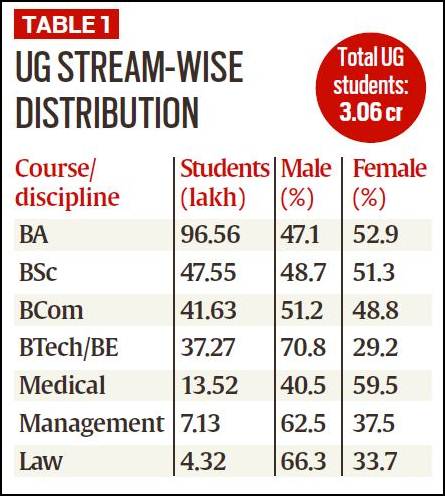
A total of 96.56 lakh students were pursuing BA in 2019-20; 47.1% of them were male and 52.9% female. Another 47.55 lakh students (48.7% male, 51.3% female) were in BSc and 41.6 lakh (51.2% male, 48.8% female) in BCom. Engineering and technology had 37.27 lakh, with the break-up skewed towards male students (70.8%). In contrast, medical coursesat UG level had a higher number of female students, at 59.5% out of 13.5 lakh (Table 1).
 Source: AISHE 2019-20
Of 7.2 lakh students in 48 central universities in 2019-20, 5.4 lakh were pursuing undergraduate programmes (Tables 2 and 3). Also, 13.97 lakh of 25.78 lakh students in state universities, and 8.4 lakh of 12.76 lakh in state private universities were undergraduate students.
 Source: AISHE 2019-20
While a consolidated number is not immediately available, in 2021, 12.96 students cleared class 12 under CBSE alone, with a pass rate of 99.37%. It is estimated that when state Boards and other Boards such as ICSE are taken into account, the number of class 12 candidates each year is over 1 crore. And due to revised assessment policies in view of the pandemic, pass percentages have gone up across boards.
The AISHE report found that14.7% of students across higher education institutes in 2019-20 belonged to the Scheduled Castes, 5.6% to the Scheduled Tribes and 37% to Other Backward Classes. Another 5.5% were Muslims while 2.3% belonged to other minority groups.
In central universities, 13.73% belonged to the SCs, 4.5% to the STs, and 17.9% to the OBCs, while 8.41% were Muslims. In state public universities, 12.34% belonged to the SCs, 3.93% to the STs, and 34% to the OBCs; 5.28% were Muslims. In state private universities, the breakup was 7.54% (SC), 4.41% (ST), 21.96% (OBC) and 4.24% (Muslim).
On March 21, the government shared in the Lok Sabha that out of 19,366 sanctioned faculty positions in the central universities, 6,558 are vacant. Also, since August 2021, 8,589 posts in the central universities, IITs and IIMs have been advertised for which the selection processes are on, the government added in a written response.
Newsletter | Click to get the day’s best explainers in your inbox