© The Indian Express Pvt Ltd
Latest Comment
Post Comment
Read Comments

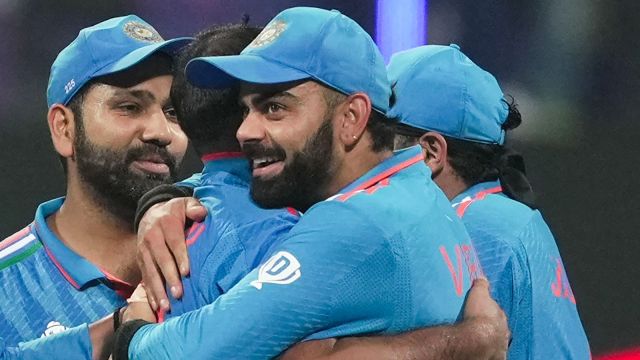 Indian skipper Rohit Sharma, Virat Kohli and other teammates celebrate their victory in the ICC Men's Cricket World Cup 2023 match between India and Sri Lanka, at Wankhede Stadium, in Mumbai, Thursday, Nov. 2, 2023. (PTI)
 On Sunday, Rohit Sharma picked up the final wicket of Netherlands’ Teja Nidamanuru and India completed the league stage of the World Cup unbeaten. Apart from New Zealand in Dharamsala and Australia in Chennai, the Men in Blue were not troubled even once in the tournament.
There is a clear bridge in the gap between India and the other teams in the tournament. The Indian Express has divided the game into six phases. The first Powerplay (1-10 overs), the second Powerplay (11-40 overs) and the final Powerplay (41-50 overs) of both India’s batting and bowling innings’ and will compare them to the remaining teams that have reached the semifinals. For this comparison, we have taken South Africa, Australia, and New Zealand as a single team (SAN) and have taken the average to understand how far India has been ahead of these teams in the tournament.
CLICK HERE TO FOLLOW OUR IND VS NZ LIVE BLOG
Batting
| Phase of play | India (runs scored on average per game) | Total Wickets lost in the phase | SAN (runs scored on average per game) | Total wickets lost in the phase |
| 1-10 overs | 67 | 9 | 57.33 | 12 |
| 11-40 overs | 165 | 23 | 171 | 32 |
| 41-50 overs | 62.14 | 12 | 80.28 | 20 |
As we can see in the table, India has been starting well in the Powerplay courtesy of Rohit Sharma’s approach. As for SAN though, it shows the average runs scored has gone down to 57.33. Australia among the three though, has been the best in the Powerplay. Travis Head, David Warner and Mitchell Marsh, similar to India, have been attempting to start games at a quicker pace. Australia scored 581 runs, which is 26 runs less than India, in the first powerplay.
However, much of the statistical difference can be attributed to South Africa. Their top order has approached this tournament differently by playing attritional cricket in the first few overs and later letting their power hitters do the job. They have been the lowest among the top four with 447 runs this phase and New Zealand has made 521 runs.
The interesting part is how the middle overs panned out. There has been a genuine attempt by the SAN category to go after the bowling in middle overs but that has come at the cost of more wickets as well. India on the other hand, has taken a step back and resorted to the old-fashioned method of strike rotation and waiting for a poor ball.
One possible reason for this might be that the Indian batters are protecting the long tail the team has which handicaps them to continue the momentum gained from the Powerplay. Australia and New Zealand possess bowlers who can bat when needed.
 For someone who usually prefers to get set in the crease before exploding, the template that has helped him score three double-centuries, Rohit has become the opposite of the batsman he was. (REUTERS)
Temba Bavuma’s men though have a similar problem of their batting ending at number seven and it seems the way they have chosen to solve it is by keeping wickets in hand in the Powerplay and increasing the scoring rate organically throughout the innings.
As per death overs batting, the statistics say much of SAN’s contribution has come from South Africa, especially during their games against England, Bangladesh and Sri Lanka where the power-packed middle order went berserk. The Proteas made 722 runs in the final 10 overs. The Aussies made 513 and the Kiwis made the least runs with 453 runs.
India on the other hand have gone to bat in the final powerplay seven times in nine games out of which they were chasing against Bangladesh and Australia, where the game finished in 41.3 overs and is the reason for the side’s low average in the phase.
Bowling
| Phase of play | India (wickets picked in each phase) | Economy | SAN (wickets picked in each phase) | Economy |
| 1-10 overs | 19 wickets | 4.3 | 15 wickets | 5.6 |
| 11-40 overs | 45 wickets | 4.5 | 41 wickets | 5.4 |
| 41-50 overs | 22 wickets | 5.8 | 19 wickets | 7.6 |
The table explains itself. India has been top-notch with the ball in all phases of the game. If batting is taking the game away from the opposition in the first 10 overs, bowlers are getting a stranglehold of the opposition batting order in that very same phase. The return of Jasprit Bumrah has made a huge difference in the bowling department for India. Though he doesn’t have the same number of wickets to show as Mohammed Siraj and Mohammed Shami, there seems to be a white flag raised by the opposition even before Bumrah bowls a delivery. They seem to be happy with just seeing off his spell.
However, that’s where this Indian side becomes superior to the others. The likes of Siraj and Shami have been phenomenal as well. Once the opposition gets through their opening spells, they are not getting much respite in the middle overs either with the spin web of Kuldeep Yadav and Ravindra Jadeja.
 The return of Jasprit Bumrah has made a huge difference in the bowling department for India. (AP)
On the other hand, with the SAN category South Africa has been ahead of Australia and New Zealand with 21 wickets in the first powerplay compared to 11 and 13 respectively. It is more than what India has picked as well. It is Marco Jansen’s opening burst which has contributed to much of the wickets tally. But those wickets came in conditions which have assisted the pacers.
When Jansen played in Kolkata with not much help on offer in the afternoon, he took a pasting against the Indian openers. That’s where it also showed the Indian seamer’s ability to keep a lid on the scoring rate when there was not much assistance in the second innings.
As for Australia, the lack of venom from Mitchell Starc upfront has made their bowling toothless in the first 10 overs. Apart from the game against India in Chennai, they have let the opposition get away with good starts. However, they pulled back games during the middle overs with Adam Zampa and displayed good skills at the death. Australia have picked up 24 wickets at the death compared to South Africa’s 15 and New Zealand’s 17.
Conclusion
The numbers we have looked at suggest that India’s domination in this tournament has come because of their impeccable performances in the first 10 overs both with the bat and ball. Indian batting seems to capitalise when the ball is new and hard with two fielders outside the ring and then take a step back when the field is spread.
The remaining teams do have areas in which they have done better than India in the tournament. Overall, the hosts have been consistent in all departments and have ranked at the top on all the metrics.
(stats by Cricket-21.com)


