


© IE Online Media Services Pvt Ltd
Tags:
Twitter India on Saturday released their data for the recently concluded Legislative Assembly Elections 2016 that took place in Tamil Nadu, West Bengal, Kerala, Assam and Puducherry. The results were declared on May 19.
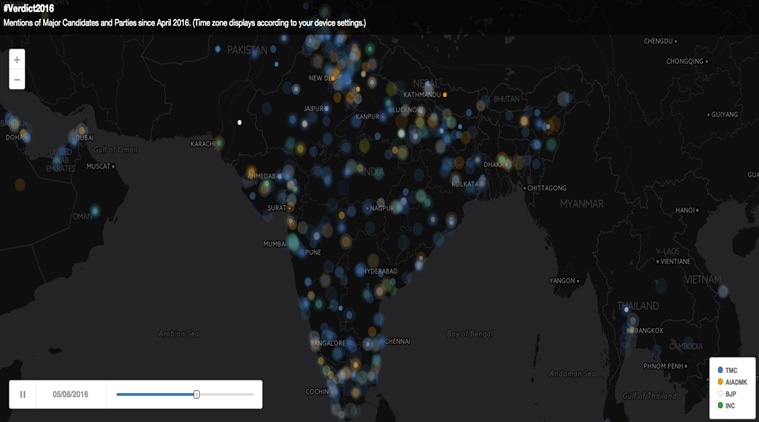
According to the data, more than 4.5 million tweets went out in multiple languages between April 20-May 20 this year. This is what the tweets looked like, when visualised on a time-lapse map. (Click here to play 30-second video)
The conversation reached fever pitch on the Counting Day (May 19) at 11:56 am with the tweet per minute count hitting 740 tweets.
As the results were announced, there were loud cheers in the BJP camp as the party scripted history in Assam bagging a government in the north east for the first time dethroning Congress. Jayalalithaa and Mamata Banerjee retained power in Tamil Nadu and West Bengal with spectacular victories. The Congress could take solace only in Puducherry where it managed to get a simple majority along with DMK to wrest power from AINRC headed by N Rangaswami, a former Congressman.

