Opinion Surjit Bhalla writes: Contrary to claims, rural wages have risen rapidly
For 2014-2018, only for nine out of 38 categories was real wage growth less than the 2.2 per cent annual increase registered by a ploughman
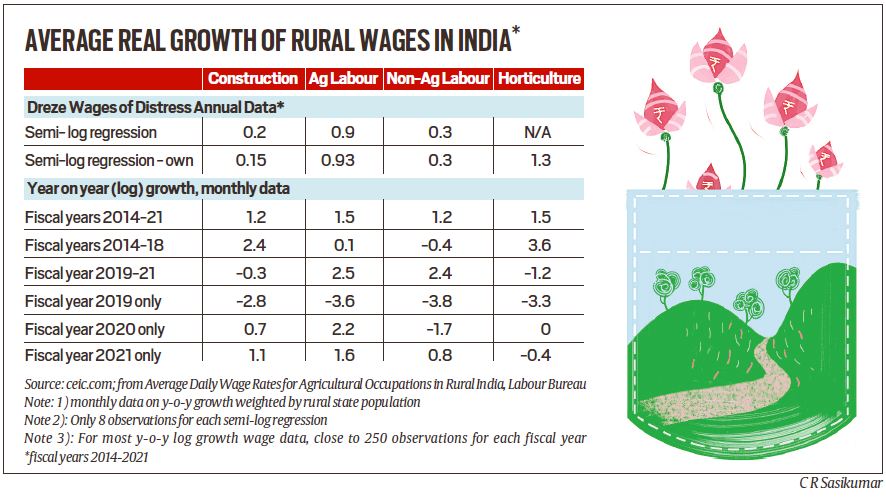
 Differences in data intensity between the two methods can be illustrated by noting the differences in one important indicator — growth in real wages of agriculture labour. (Illustration by C R Sasikumar)


Rural real wage growth is an important indicator of the well being of individuals, especially the poor. It is for this reason that I read with considerable interest a recent article (IE, April 13, “Wages of Distress”) by one of India’s well-known and most respected economists, Jean Dreze. Dreze, a former member of the Sonia Gandhi-led National Advisory Council, makes startlingly pessimistic conclusions about the Indian economy. His major point is there is a “stark and disturbing contrast between the rapid growth of the Indian economy and the sluggish growth of (rural) real wages” between 2014-2021.
I was surprised by these conclusions and decided to do a deep-dive into the data used to arrive at the above finding. I obtain very different results. In a nutshell, for construction workers, Dreze obtains a rate of growth (hereafter CAGR) of just 0.2 per cent (actually 0.15 per cent); I obtain a CAGR eight times larger at 1.2 per cent. For non-agricultural labourers (porters and loaders) the same yawning divergence: Dreze 0.3 per cent vs my own 1.2 per cent, for agricultural labourers, 0.9 per cent vs 1.5 per cent.
Why are the two results so different? The answer lies in the data and the method of estimation. Dreze obtains his data from the RBI website and rues the fact that the website does not report wages for rural women workers. Actually, the original source of the data, http://www.labourbureau.gov.in via its publication Rural Real Wages in India, reports rural wages for 38 occupations, 24 for men and 14 for women. Thus, there is no difference in the source, method of collection of the “raw” data used by either Dreze or myself. There are sharp differences, however, in the selection of the data and the method of estimation.
The RBI reports the data for only four male occupations, one of which “males in horticulture” Dreze ignores because such data are reported for only a few states. For the record, the CAGR for male horticulture workers was 1.5 per cent and for women 1.6 per cent (data reported for seven large states). Incidentally among the 38 odd sex-occupation categories, horticulture real wage growth is among the top 2 or 3.
There are other differences in the treatment of data. Dreze chooses to take a shortcut by using RBI’s national level data. Normally, this is a reasonable practice, but not when one has only eight observations and when three of these observations are for an unusual Covid period. The original source has monthly data for each sex-occupation category. Use of all of these data allows for a more accurate estimation of wage trends.
Moreover, the interest is in real wages, not nominal wages. Real variables are formed by deflating nominal aggregates by price levels. Dreze chooses to use the national rural price level (CPI for agricultural labourers) — one estimate for the entire country for each of the eight fiscal years. We choose to use the CPIAL price level specific to the state for each month.
Differences in data intensity between the two methods can be illustrated by noting the differences in one important indicator — growth in real wages of agriculture labour. Dreze has 16 units of macro information — national average for each year (unclear how that was obtained) and national average for CPIAL (also unclear how that was obtained). In our case, there are 20 states, eight years, and 12 months in each year. For male agricultural labourers, there are 228 unique observations for each fiscal year; for eight years, 1,824 observations plus 240 observations each for price level and 20 for rural population. That is more than 2,000 units of data to obtain one estimate of average growth.
There is also a difference in the method of estimation. Dreze uses a semi-log regression on eight observations to estimate the CAGR for each of three male occupations. For two of these occupations, construction and non-agricultural labourers, his estimate of CAGR is not even significant at the 11 per cent level of confidence, and construction is not even significant at the 50 per cent level.
In other words, the statistical basis of the all important growth rate is very weak and suspect. Our method to estimate the CAGR is to estimate a population weighted average of year-on-year growth for each of the 38 sex-occupation categories. We estimate the real wage for each sex-occupation for each month, using the price level particular to each location. This yields a monthly real wage for each sex-occupation; from this we estimate growth for each sex-occupation-month. Given state level rural population data, an approximation to the national mean growth can be obtained (with rural population share as weights).
The problems with Dreze’s estimates do not end with just data, observations or method. It also extends to his chosen time period of analysis, 2014-21. No study we know of combines pre-Covid and Covid years without even a mention of the “difference”. In the table we present data for three time periods — the normal 2014-18, Covid 2019-21, and for all years, 2014-21; plus annual averages for each of three years 2019-21. We have excluded 2019-20 from the pre-Covid period not so much because of a minor Covid overlap, but more because exceptionally tight monetary policy in India pushed per-capita growth in that year to only 2.8 per cent. Indeed, 2019-20 is a super-outlier with a devastation unmatched in rural wage history (at least since 1999) — average rural wage growth of minus 3.3 per cent across 38 rural wage categories. A formal recounting of what happened to GDP and rural wage growth in 2019-20 is yet to be conducted.
For 2014-2018, only for nine out of 38 categories was real wage growth less than the 2.2 per cent annual increase registered by a ploughman. Wage growth for (male) sowing, ploughing, and harvesting averaged 2.6 per cent per year. This is high real wage growth and consistent with per-capita GDP growth of 5.9 per cent for these five years. For reference: Per capita GDP growth averaged 6.4 per cent during the high-growth years 2004-2011, a period when wage growth for (male) sowing, ploughing, and harvesting averaged 3 per cent per year.
There is one important side result of our detailed analysis. One reason there is more than a causal interest in what happened to rural wages is because of the paucity of official data on poverty post 2011-12. As we all know, the NSS consumption survey for 2017-18 was not released because of data-quality concerns. Many have accused the government of data suppression and/or censoring data “because data was not comforting to the government”. Real wage data for 2015-18 can shed some light on the “accuracy” of estimates of the suppressed 2017-18 data.
According to the leaked results, the 2017-18 survey data showed that real rural per capita consumption declined by 8 per cent over 2011-12. We now have real wage data showing that between 2014-18, average male-female wages in agricultural operations grew at a 2.9 per cent rate or that in 2017-18 average wages were 16 per cent above the 2013-14 level. Even if one were to assume that real wages or real consumption stayed the same as in 2011-12 (and we shouldn’t assume that) the 2017-18 NSS survey may have had exceptionally unusual data quality problems with their consumption and hence poverty estimate. An issue which obviously deserves deeper study; the chapter on what happened with the 2017-18 NSSO consumer expenditure survey remains open.
Bhalla is former Executive Director IMF and former Member of the Economic Advisory Council to the Prime Minister