© The Indian Express Pvt Ltd

 How does Odisha, despite being one of larger producers of paddy, have the lowest debt to GDP ratio? We explain (Express File Photo)
 Dear Readers,
During his recent interview to new agency PTI, Prime Minister Narendra Modi underscored the need for fiscal discipline, which essentially refers to governments spending within their means.
“You are well aware that I have urged our state governments to be conscious about financial discipline as well. Whether it is in the National Conference of Chief Secretaries or any such platform, I have said that financially irresponsible policies and populism may give political results in the short term but will extract a great social and economic price in the long term. Those who suffer those consequences the most are often the poorest and the most vulnerable,” said the PM.
Although the interview was in the context of the upcoming G20 summit, PM’s comment has also placed state government finances in sharp focus yet again. PM Modi and his political opponents have been arguing about the issue of populism and the politics of dole (revdi culture) — what constitutes it and who is responsible for worsening it.
The economists at Bank of Baroda (BoB), a public sector bank, recently analysed the state of state finances based on the latest Budget data collected by PRS Legislative Research, a not-for-profit research organisation.
They analysed data for 27 states on four different counts:
Looking at these four criteria makes a lot of sense.
Fiscal Deficit tells us how much a state government has to borrow in the current financial year to meet the gap between its expenditures and revenues. Under the existing prudential norms, fiscal deficit should not exceed more than 3% of a state’s GDP.
Debt levels tell a longer-term story. If a state has been recklessly borrowing year after year, it would end up having a huge pile of debt. Under the existing prudential norms, debt should not go beyond 20% of a state’s GDP.
Outstanding guarantees refer to debts that are on the books of state government-run entities but are effectively backed by the state government. For instance, a state government-run electricity distribution company or an irrigation utility. Often such entities subsidise consumers by not charging the full price. In the process, they run up a debt which, in the final analysis, has to be paid by the state government. State governments that do not allow their entities to run up high debts (by charging market prices) end up having lower outstanding guarantees.
The fourth metric captures the net result of running high deficits and debts: That one has to pay higher interest costs. This is akin to a common man having to pay a higher EMI for a bigger loan. However, this interest payout is expressed as a percentage of the state government’s total revenues. Again, just as a person with a big income can afford a big interest payment, so can a state pay higher interest payments despite high debt if it knows how to earn enough revenues.
Chart 1 maps the first two metrics. The fiscal deficit (as a percentage of GSDP) is plotted on the vertical axis and the total debt (as a percentage of GSDP) is mapped on the horizontal axis. That’s because to arrive at the best and worst performers, one has to see the combined performance on both the counts.
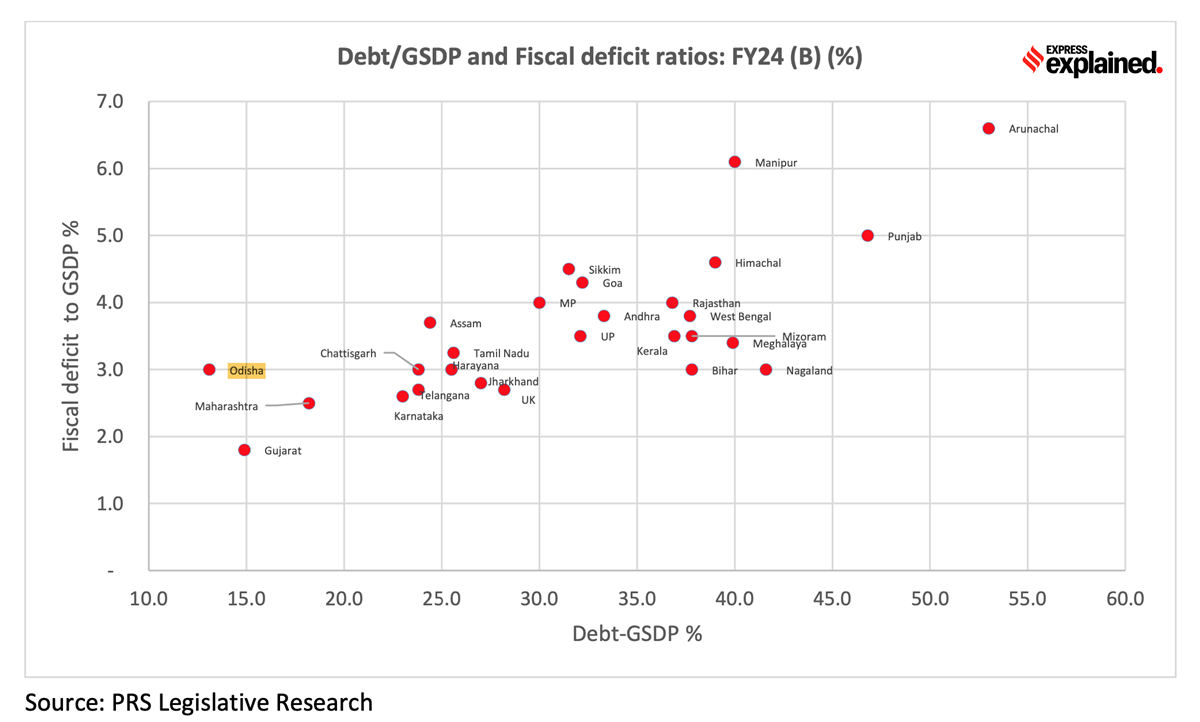 Chart 1 looks at the fiscal deficit and debt accumulated by states
On debt levels, only three states — Odisha, Gujarat and Maharashtra — in India manage to meet the prudential norm. However, within the three, it is Odisha which has the lowest debt levels; this shows it has contained its annual fiscal deficit far better than the other two states over the recent past.
Barring these three, the situation just gets progressively worse.
There are four states — Karnataka, Telangana, Assam and Chhattisgarh — which are at a debt level of less than 25%.
The next five — Tamil Nadu, Haryana, Jharkhand, Uttarakhand and Madhya Pradesh — have debt ratios between 25%-30%.
But as many as 15 states (out of the 27 for which data was available), had debt levels in excess of 30% of the state GDP (or GSDP). Four states, in particular, raise a red flag: Manipur, Nagaland, Punjab and Arunachal Pradesh.
On the fiscal deficit front, three states — Punjab, Manipur and Arunachal — have fiscal deficit of 5% and above.
Taking into account the performance on both metrics together, Odisha comes out on top while Punjab lies at the bottom.
Odisha continues to do well in the third metric as well as shown by Chart 2.
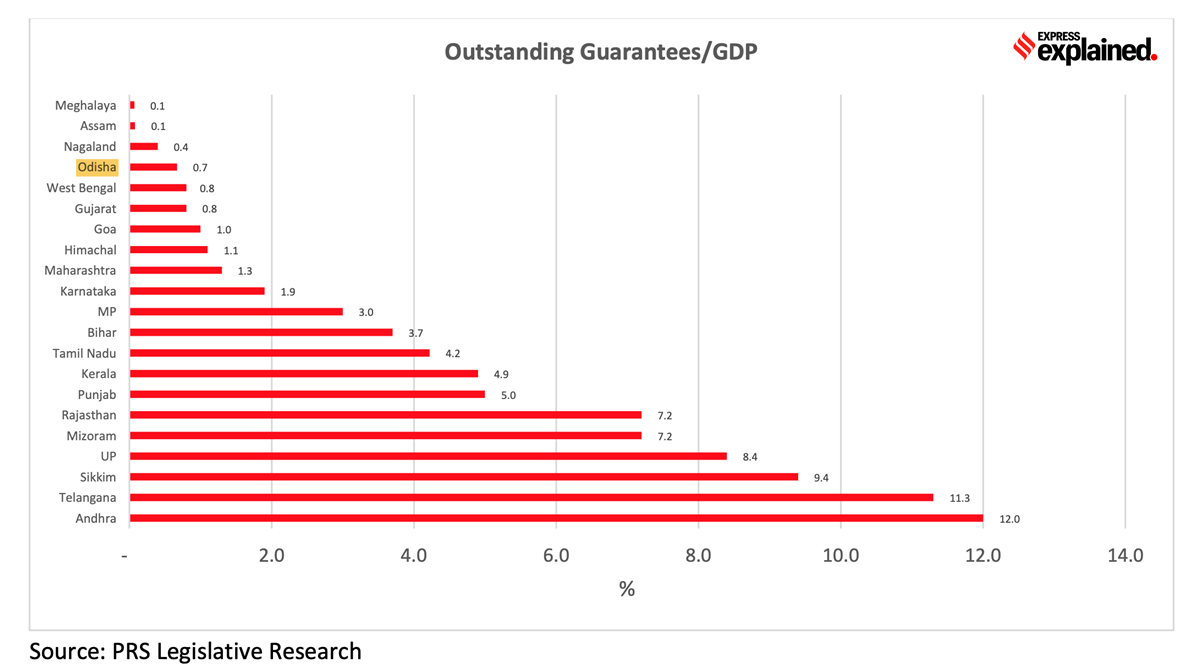 Chart 2 looks at the outstanding guarantees that a state government provides
However, it should be noted that the chart has information for just 21 states, and the outstanding guarantees (as a percentage of GSDP) are for the latest year available, which can be FY21, FY22 or FY23.
“This is another aspect of debt that has to be monitored because while the probability of invocation of guarantees is low, it pressurizes the states nonetheless and is not looked upon positively in the context of fiscal prudence,” states the BoB report.
Lastly, Chart 3 maps the impact high debt.
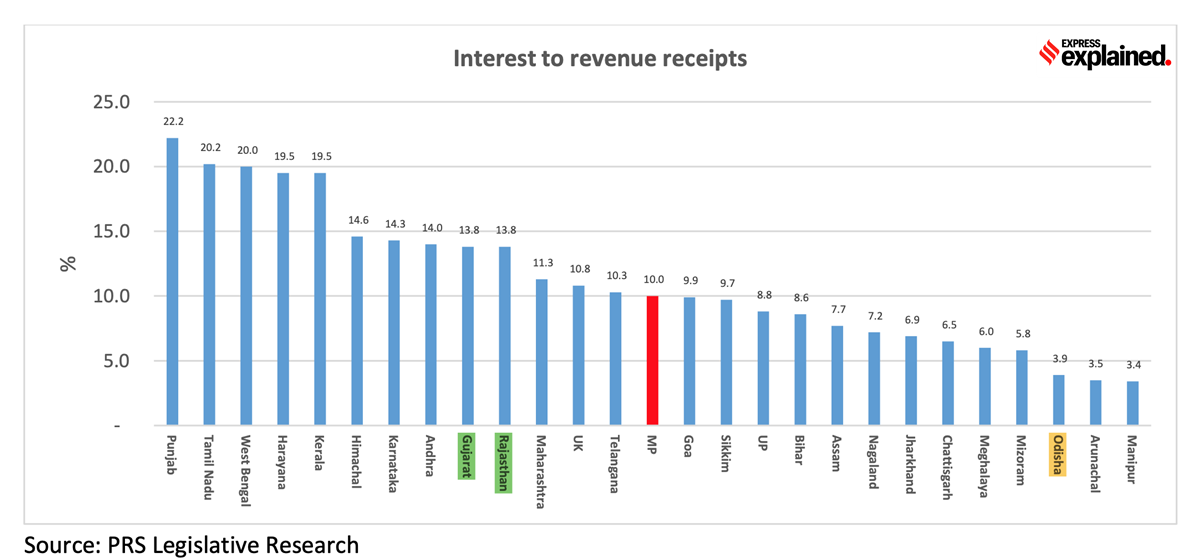 Chart 3: Odisha stands out among the bigger states of India
“As debt increases so does the interest outgo, which in turn puts pressure on the revenue account as a larger part of the revenue receipts are used to pay interest which means that less is left for other purposes,” explains the BoB report.
Here, again, Odisha stands out among the bigger states of India.
It is also noteworthy to look at how Gujarat and Rajasthan (both highlighted in green) are at the same level. In other words, even though Gujarat has much lower fiscal deficit, outstanding guarantees and overall debt ratios than Rajasthan, when it comes to the impact of high debt, Rajasthan is none the worse. That’s because Rajasthan’s revenues (the denominator in this ratio) has also grown proportionately, thus making it possible for it to afford the interest outgo.
In the final analysis, Odisha seems to lead the rest of India.
“The debt to GDP ratio is the lowest and there are low contingent liabilities. The fiscal deficit too has been within the FRBM norms and the debt servicing ratio very low. This is a position of both comfort and strength,” concludes the BoB analysis.
Punjab, on the other hand, is the one big state that is pressurised on all counts — debt ratio, fiscal deficit, guarantees and debt servicing.
These results are similar to the findings of a report released by CARE Ratings at the start of 2023. It, too, pegged Odisha as the best and Punjab as the worst among the major states on fiscal parameters.
Madan Sabnavis, the Chief Economist of BoB, says that in Odisha’s case fiscal rectitude is more a case of astute expenditure management than revenue generation. That’s because states have limited scope of revenue generation. Sabnavis out lines three main reasons for Odisha’s continued success:
Sticking to annual fiscal deficit targets. Doing this ensures that Odisha doesn’t face higher interest rates and that keeps borrowing costs at a minimum.
Not compromising on expenditure. This means sticking to what is planned and not resorting to ad hoc changes mid-year.
Having realistic budget estimates for both income and expenditure. Sabnavis says that often when a state government is struggling to meet the fiscal deficit target, it can resort to overstating its revenues and understating its likely spending. Presenting a realistic pictures helps Odisha government live within its means.
What may further help Odisha’s cause, as against a Punjab, is the fact that despite being one of larger producers of paddy, the state doesn’t run up a large subsidy bill (say on account of electricity or irrigation etc.) because it gets more rainfall than a Punjab, which has to produce a bulk of India’s wheat despite more erratic rainfall.
Share your views and queries at udit.misra@expressindia.com.
Until next time,
Udit