© The Indian Express Pvt Ltd

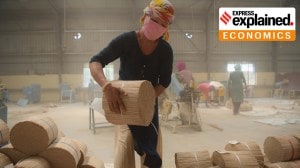
 In everyday parlance, the unemployment rate often dominates the general public discourse. However, in India’s case, it often underestimates the joblessness because the labour force participation rate itself keeps falling. (Express file photo by Tashi Tobgyal)
 Dear Readers,
The Bihar government has released some details about the state’s caste survey that was conducted this year. The survey provides an understanding of how the whole population of the state is divided into different caste categories such as Backward Classes, Extremely Backward Classes, Scheduled Castes, Scheduled Tribes, General (or unreserved) etc.
In the days to come, more information from this survey will be released and the general public will hopefully be able to make sense of it. The caste details could likely have massive political implications. That’s because, in India, caste often plays a crucial role in determining the economic fortunes of people.
In this edition, ExplainSpeaking will look at the caste-wise data on two broad counts — employment and consumer sentiments — sourced from the Centre for Monitoring Indian Economy’s (CMIE) Economic Outlook. The CMIE provides data for all the main caste groupings.
There are three variables that one needs to look at when talking about employment in India.
One is the Labour Force Participation Rate (LFPR). Simply put, it gives a sense of how many Indians are “demanding” a job.
The “Labour Force” consists of persons who are of 15 years of age or more and are either of the following two categories:
The LFPR is expressed as a percentage of the working-age population.
The second variable is Unemployment Rate (UER). It is nothing but the number of people in the labour force who are looking for a job but as yet unemployed. The UER is expressed as a percentage of the labour force.
In everyday parlance, the unemployment rate often dominates the general public discourse. However, in India’s case, the UER often underestimates the joblessness because the LFPR itself keeps falling.
Simply put, it has been found that if they do not get a job over time, a lot of unemployed people get discouraged and leave the labour force (that is, stop actively looking for a job). With unemployed people leaving the labour force, the ratio of unemployed to total labour force falls. As such, often in India, the UER falls not because more people have got jobs but because the LFPR itself falls (that is, when more people — who failed to get a job — stop looking for a job altogether).
As such, the best metric to look at is Employment Rate (ER). The ER dispenses with the labour force calculation and simply looks at the total number of people employed as a percentage of the working-age population. By not basing itself on LFPR, the ER avoids the problem of a falling LFPR artificially dragging the unemployment rate. Here’s a previous edition of ExplainSpeaking that explains this issue in greater detail.
Now for what the data shows.
Table 1 gives the details of caste-wise LFPR since the start of the 2016 financial year.
Apart from the well-known groupings, the intermediate castes grouping refers to castes such as Marathas, Jats, Gujjars, and others who often aspire to be included in the OBC category.
 Table 1 on Caste-wise Labour Force Participation Rate in India
The data shows some very clear trends.
One, LFPR has fallen for each caste. If one ignores the data for the category for which caste was not available, then the LFPR of the so-called upper castes is the lowest among all other castes; it is 37.21%. In other words, the demand for jobs is the lowest among the upper castes.
Two, the biggest fall in LFPR since 2016, however, has been among OBCs and SCs. In other words, people belonging to these two caste groupings have been the worst affected by the negative trend of India’s LFPR.
Table 2 shows the UER for each caste group.
The UER has remained persistently high for India. Moreover, notwithstanding India’s economic recovery, it was higher in the last financial year (2022-23) than six years ago.
 Table 2 on Caste-wise Unemployment Rate in India
This is true for all caste groups barring the OBCs, for whom the unemployment rate has fallen marginally. That UERs are higher despite LFPRs falling points to the more worrying trend — that UER is higher even when the proportion of people demanding a job has come down.
As far as the fall in the UER for OBCs is concerned, it has happened as the LFPR for them has witnessed the biggest fall among all caste groups.
TABLE 3 best captures the combined reality of falling LFPR and high UER for each caste category. This table provides the Employment Rate and as the table shows, the ER has fallen for each and every caste group.
 Table 3 on Caste-wise Employment Rate in India
In other words, the proportion of people belonging to a particular caste in the working-age population who are employed has been coming down for every caste.
Again, while the upper castes have the lowest employment rate, the biggest drop in ER has been witnessed among OBCs and SCs.
Reportedly, the Bihar caste survey looked at caste across religious identities as well. In other words, it categorised non-Hindus (such as Muslims) into different castes.
As such, it might be relevant here to look at the religion-wise employment rates as well.
 Table 4 on Religion-wise Employment Rate in India
Table 4 throws up a very interesting result: Among the main recognised religions, it is the Hindus who have suffered the biggest fall in employment rate between 2016-17 and 2022-23 even as the Jains have the lowest employment rate.
Table 5 maps the absolute levels of CMIE’s index of consumer sentiments for each caste. According to CMIE, the main aim of the Consumer Sentiments Index is to measure perceptions and expectations accurately so that the business community can understand the mood of the consumer and anticipate changes in the same.
 Table 5 on Index of Consumer Sentiments in India
For one, the data shows that the consumer sentiments for almost all caste groups are 20% to 25% below their 2016-17 levels. The lowest levels of consumer sentiment were for the OBCs. However, the worst affected were the intermediate castes — the castes who aspire to be included in the OBC category.
Should there be a caste survey for the whole country? Will India benefit from having a caste survey?
Share you views and queries on udit.misra@gmail.com
Until next time,
Udit