© The Indian Express Pvt Ltd
Journalism of Courage

 Compared to other major states, the Delhi government has one of the highest education expenditures as a share of total expenditure at 21%. (Express file photo by Praveen Khanna)
Ahead of the Delhi Assembly elections, scheduled for February 5, development particularly in the health and education sectors has been a key plank of the ruling Aam Aadmi Party (AAP). While the almost entirely urban Delhi is among the most populous cities in the country, its per capita income is high and poverty rates low, though there are some pockets of the city that continue to struggle.
A demographic breakdown of Delhi:
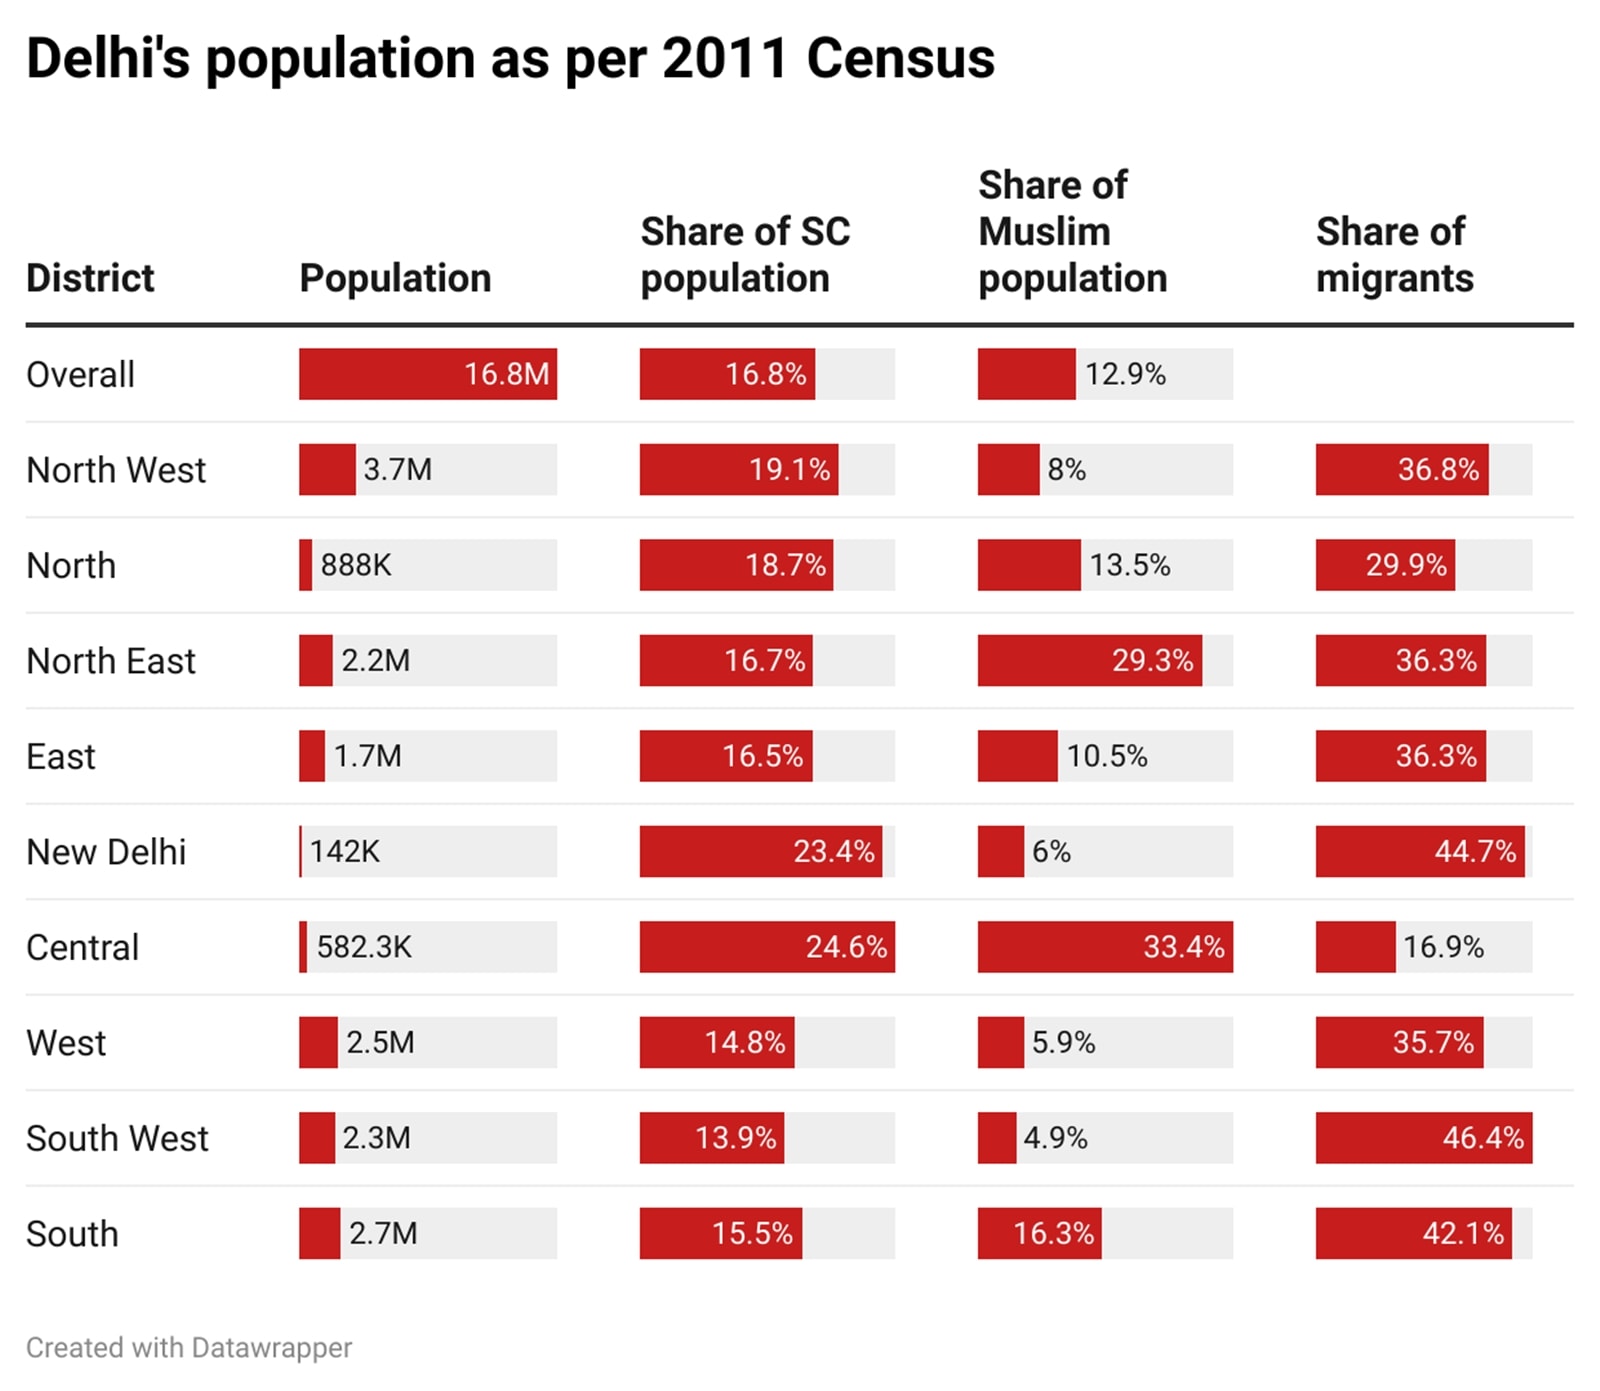
As an urban agglomeration, the Delhi-NCR region is the second most populous in India after the Mumbai Metropolitan Region. As per the 2011 Census, the latest available population data, the Union Territory of Delhi has a population of 1.68 crore, a rise of 21.2% from 2001, and projected to reach 2.25 crore in 2026.
Of Delhi’s nine districts, the most populous is North West Delhi, accounting for 21.8% of the UT’s population, followed by South Delhi at 16.3%, and West Delhi at 15.15%. The New Delhi and Central districts are the smallest by population, at 3.5% and 0.9%, respectively. These districts are home to government offices and are thus sparsely populated. Most of Delhi is urban – the North West and South West districts have the largest rural populations, but at just 5.9% and 6.3%, respectively, with the UT’s overall rural population at 2.5%.
 Delhi demographics – population, SCs, Muslims, migrants
Between 2001 and 2011, South West Delhi was the fastest growing district by population with a growth rate of 30.7%. Only two districts saw their populations fall in this period – New Delhi by 9.9% and Central Delhi by 20.7%.
Scheduled Castes (SCs) accounted for 16.8% of the UT’s population in 2011. The highest concentration of SCs are in the Central and New Delhi districts, at 24.6% and 23.4% of the population, respectively. Between 2001 and 2011, North East Delhi saw the highest increase in SC population, growing by 26.7%.
A breakdown by religion as per the 2011 Census shows that Hindus are at 81.7% of the population, while Muslims at 12.9% are the largest minority group. The highest concentration of Muslims is in the Central and North East Delhi districts, at 33.4% and 29.3%, while their lowest concentration, of 4.9%, is in South West Delhi. Muslims account for more than a tenth of the population in four districts – North, North East, East, Central, and South.
Delhi has an estimated 22.6 lakh migrants, as of 2011. The South West, New Delhi and South districts have the highest concentration of migrants, at 46.4%, 44.7% and 42.1%, respectively. The top reasons for migration are family and employment.
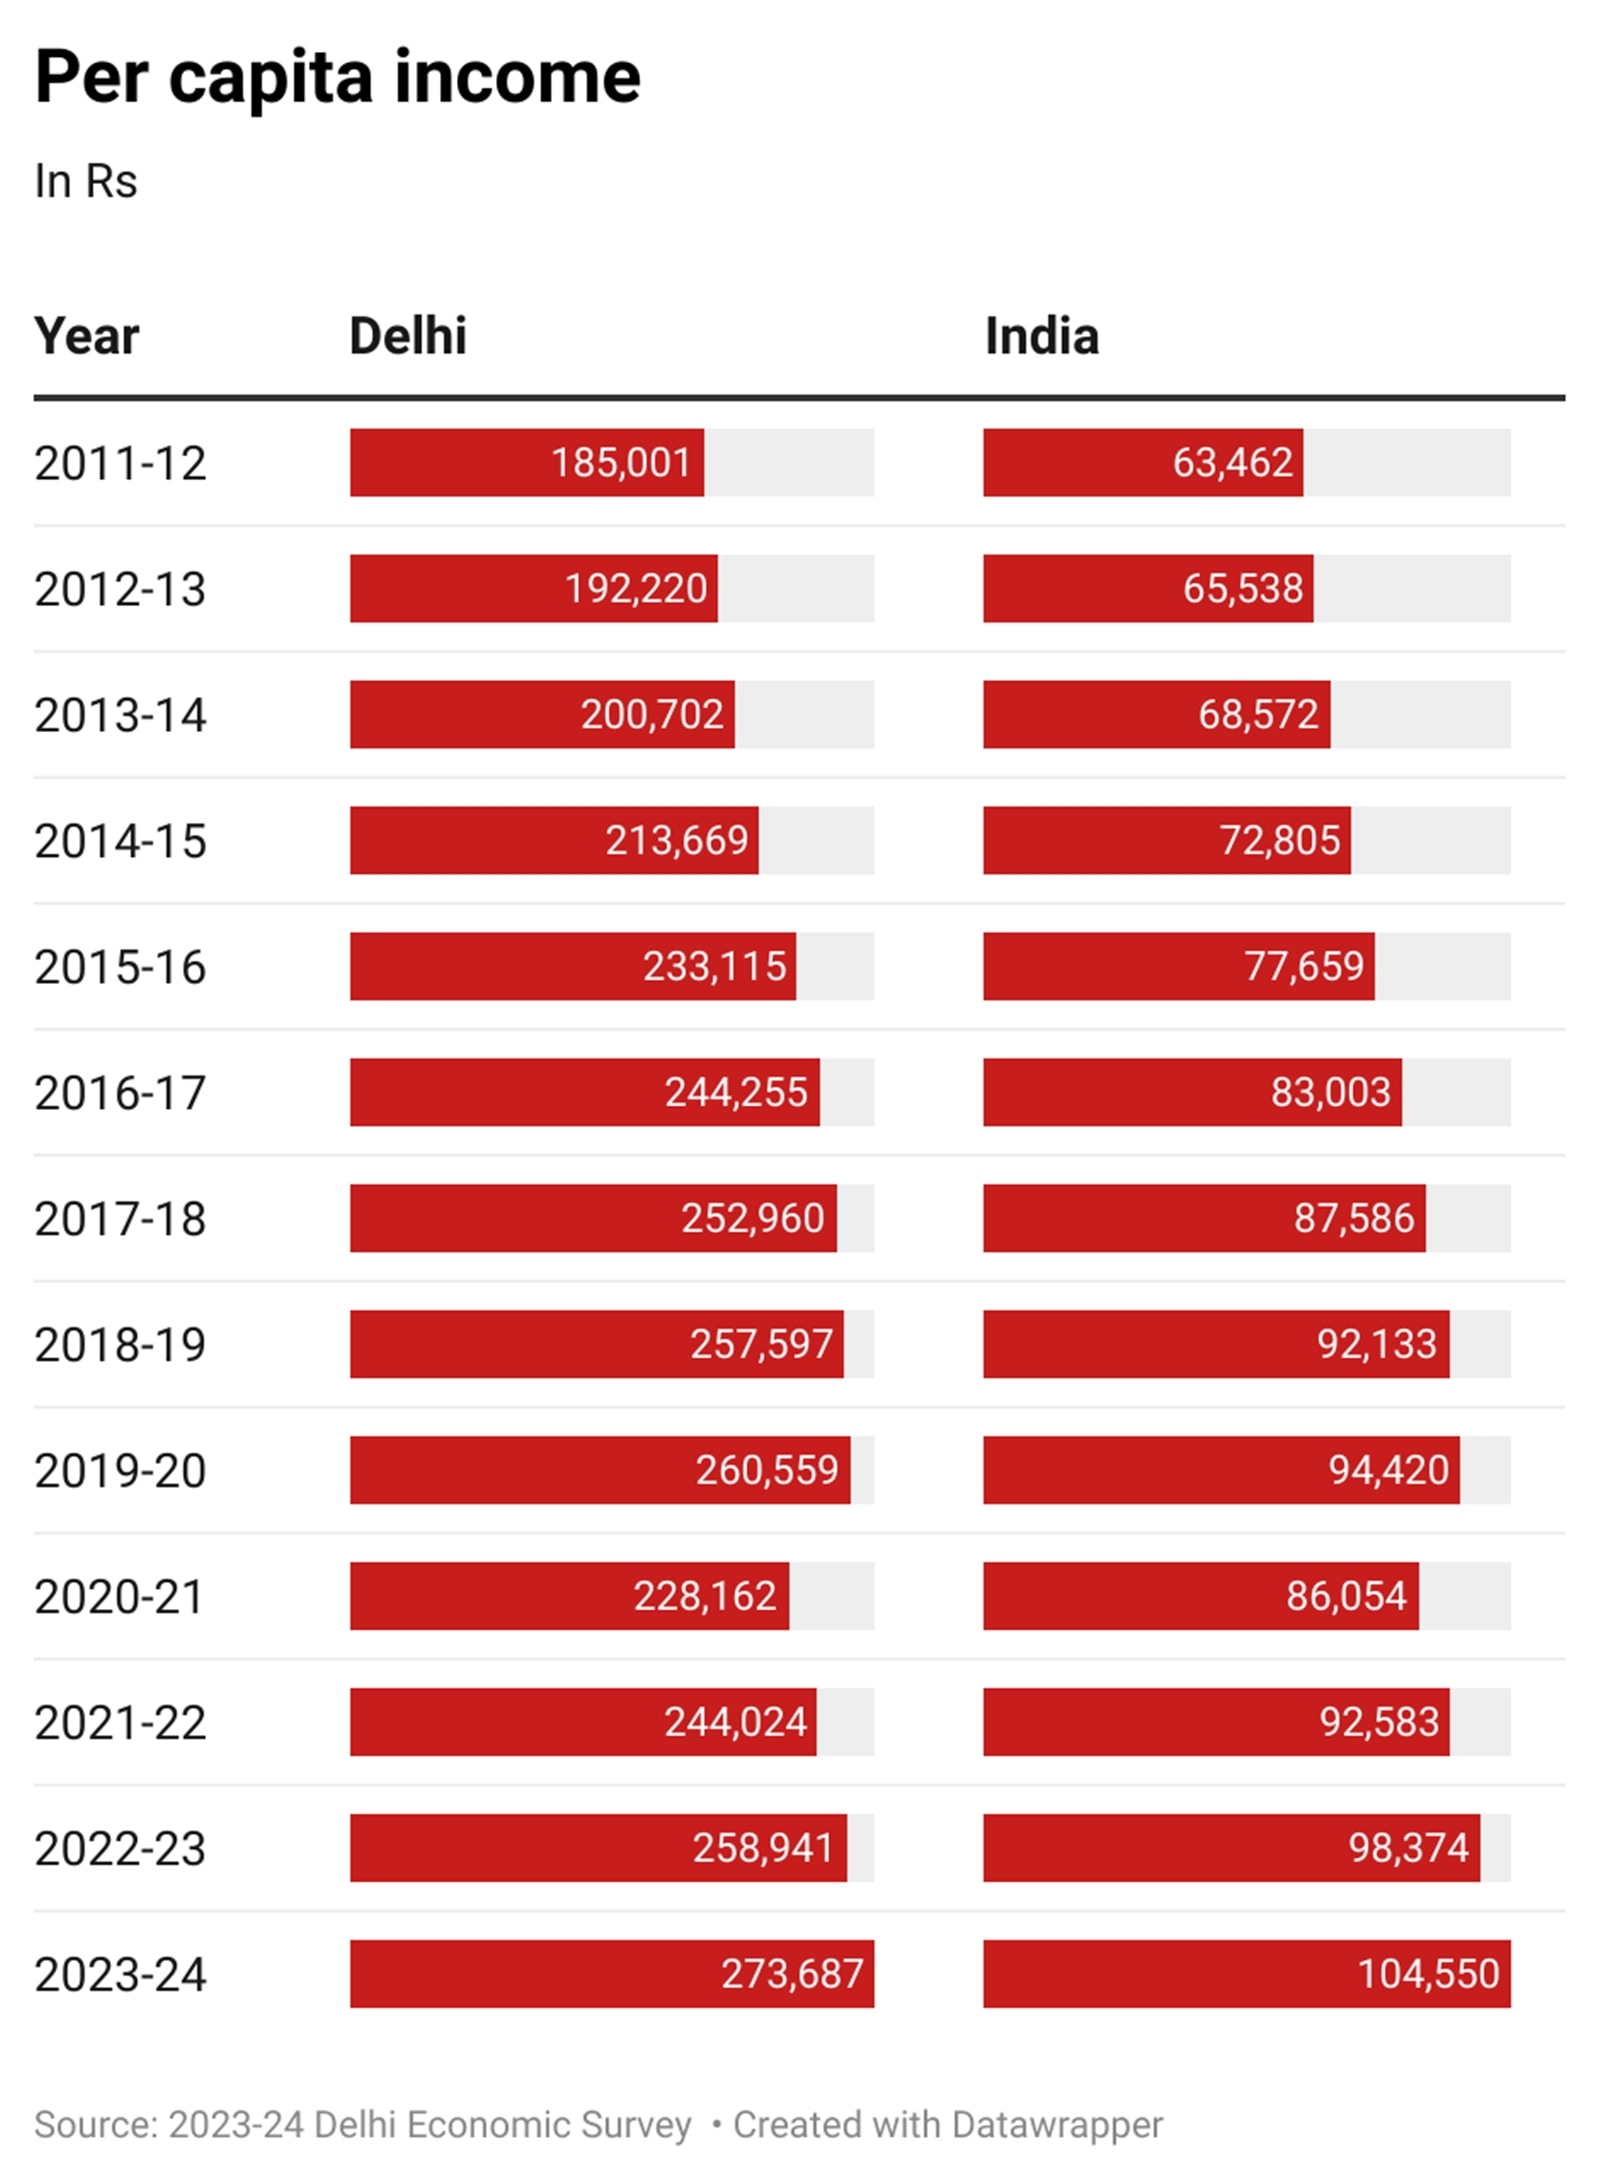
As the administrative and political centre of the country, Delhi unsurprisingly has among the highest per capita incomes across India, as per data from the Reserve Bank of India (RBI) and Delhi Economic Surveys.
At Rs 2.59 lakh per annum in 2022-23, only Goa and Sikkim’s per capita incomes exceeded that of Delhi. In 2023-24, Delhi’s Rs 2.74 lakh per capita income was more than twice the national average of Rs 1.05 lakh. Given its already high level, per capita income in Delhi grew by a moderate 17.4% between 2015-16 and 2023-24, as compared to the growth in national per capita income by 34.6%.
 Per capita income, Delhi vs India
Similarly, Delhi’s monthly per capita expenditure, which is a measure of spending capacities, stood at Rs 8,217, well above the India average of Rs 6,459.
Unemployment, as per data compiled by the RBI, in Delhi was below the national average for urban regions but higher for rural areas. Delhi’s urban unemployment stood at 20 per thousand population in 2023-24, compared to the national average of 51. But Delhi’s rural unemployment, at 60, was more than twice the national average of 25 per thousand.
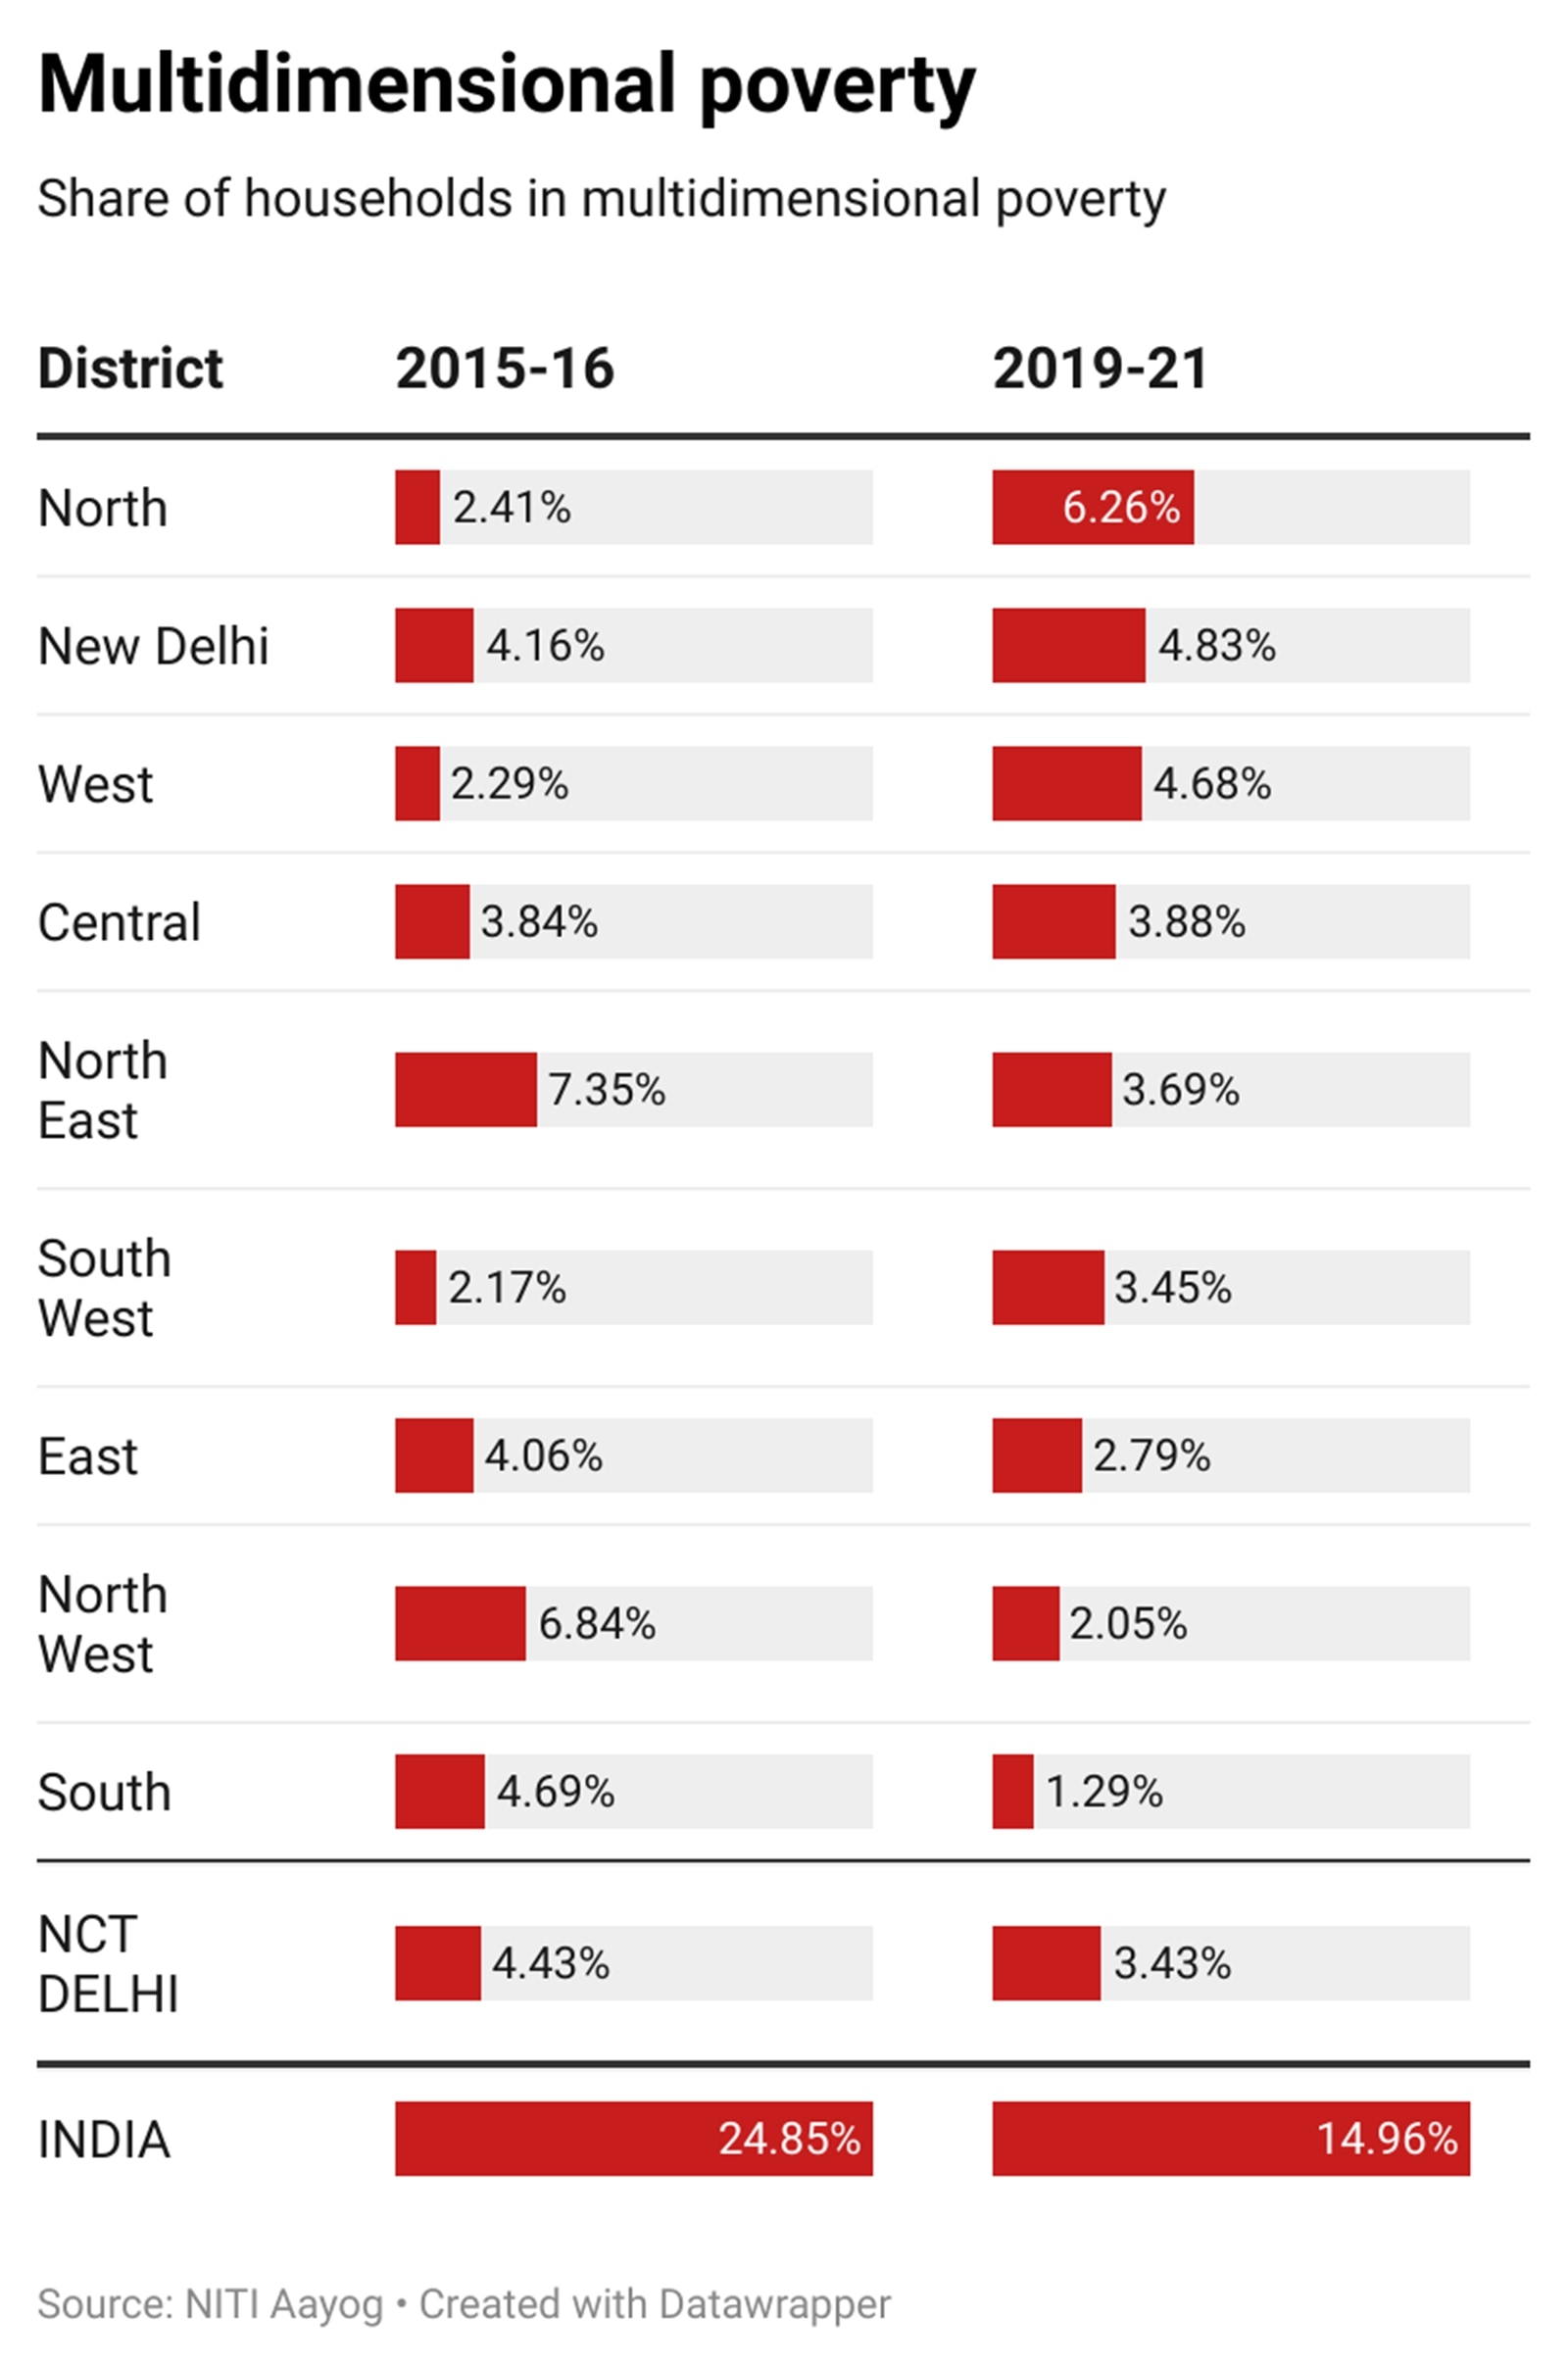
The NITI Aayog’s Multidimensional Poverty Index shows that the extent of Delhi’s population considered poor fell from 4.4% of the population in 2015-16 to 3.4% in 2019-21. Only Kerala, Goa, Tamil Nadu and Sikkim had a lower poverty rate in 2019-21. In contrast, the national average stood at 15% in 2019-21, down from 24.9% in 2015-16.
 District-wise poverty
Among Delhi’s districts, the highest poverty rate was recorded in North Delhi at 6.3%, significantly higher than in South Delhi at 1.29%.
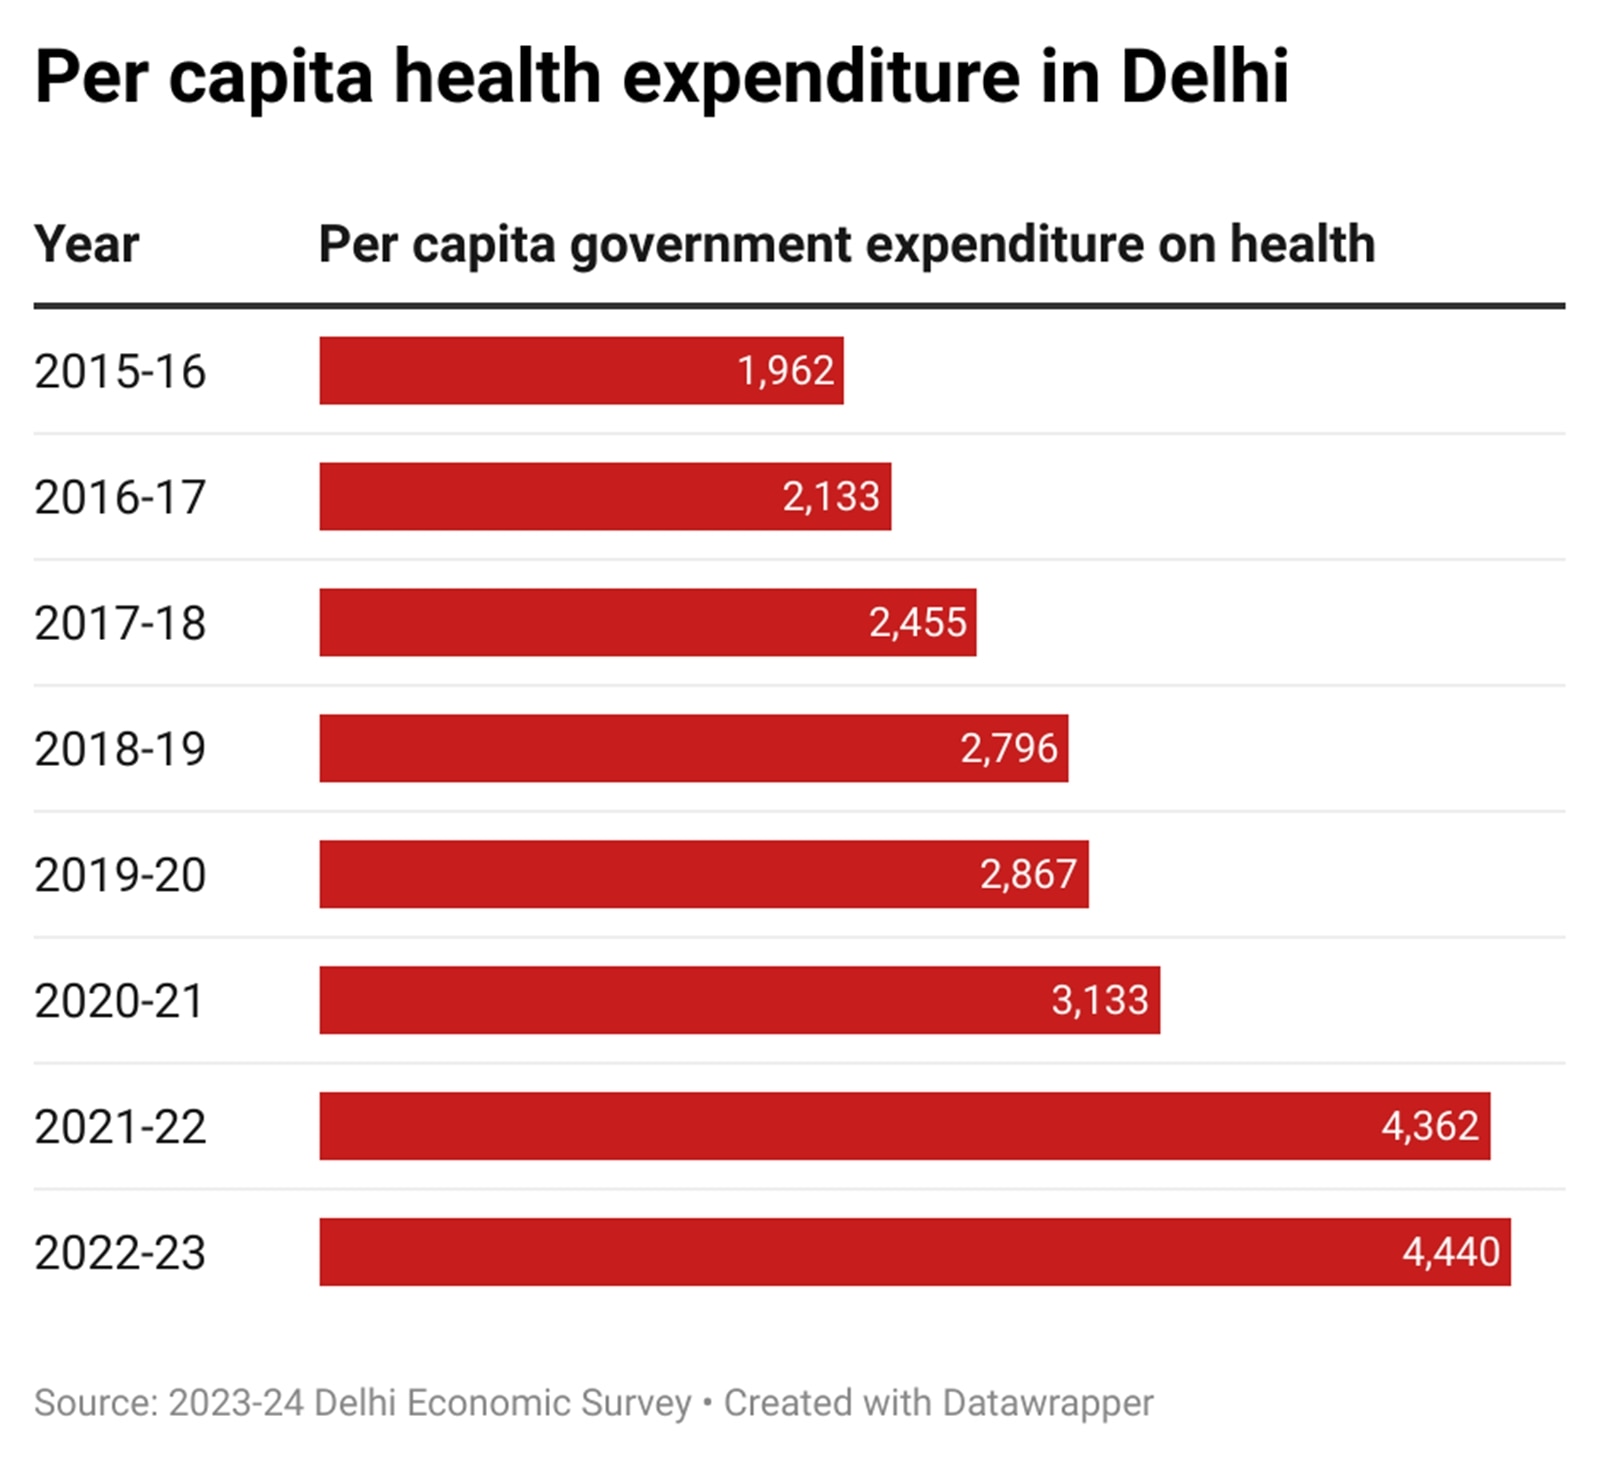
In Delhi, where the AAP government’s health push has been at the centre of its recent election campaign messaging, the per capita expenditure on health stood at Rs 4,439 in 2022-23, more than twice the 2015-16 spend of Rs 1,962, as per the 2023-24 Economic Survey.
 Per capita health expenditure
While access to electricity, clean drinking water and sanitation is generally high across Delhi, health insurance coverage remains low, stunting among children under 5 is prevalent and almost a majority of the city’s women are anaemic, as per the 2019-21 National Family Health Survey (NFHS)
For all of Delhi’s districts, access to electricity and drinking water is at close to 100%, though improved sanitation facilities are lagging at 81.1% of Delhi’s households. The New Delhi district has the lowest access to sanitation at 69.4%.
While 41% of Indian households have at least one member covered by a health insurance scheme, the figure stands at just 25% for Delhi. Among the districts, North Delhi has the lowest insurance coverage at 18.1%, while the highest is in South West at 37.7%.
In terms of nutritional outcomes, as per the NFHS, 30.9% of children under 5 are stunted (low height for age), 21.8% are underweight, and 11.2% are wasted (low weight for height). Stunting is the most prevalent issue among these – at 38.5%, North East Delhi has the highest rate among the districts. East Delhi is the worst for underweight and wasted children, at 29.9% and 15.7%, respectively. Anaemia, a blood disorder, is also a persistent issue for women aged 15 to 49 years. While 44.6% of women in this age group in Delhi have anaemia, in four districts – West, South West, New Delhi and North West – the figure is over 50%, the highest in West Delhi at 57.2%.
Among the major health indicators is infant mortality rate (IMR), which stands at 24.5 per 1,000 births, well below the national average of 35.2. It’s worth noting that institutional births at public facilities have grown from 55.5% in 2015-16 to 62.4% in 2019-21. In the same period, the average out-of-pocket expenditure per birth at government hospitals fell from Rs 8,518 to Rs 2,548.
Compared to other major states, the Delhi government has one of the highest education expenditures as a share of total expenditure at 21%. While the national average is 13.3%, the next highest state after Delhi is Chhattisgarh at 18.2%. The figure for Delhi has exceeded 20% every year since 2016-17, as per the UT’s 2023-24 Economic Survey.
Though literacy rate has exceeded 80% since 2001, Delhi figures among the highest in the country on several education indicators, including pupil-teacher ratio, gross enrolment ratio, average teachers per school, and low dropout rates, as per the Unified District Information System for Education (UDISE) 2023-24 report.
Across India, Delhi has the fifth highest pupil-teacher ratio at 28, the second highest average number of teachers per school at 29, and has the fourth lowest number of single-teacher schools. Delhi has the fifth highest gross enrolment ratio (student attending school as a share of those in the eligible age group) for the secondary and middle school levels. However, Delhi ranks much lower for dropout rates – 19 states and UTs have a lower dropout rate than Delhi at the secondary level, though it is tied at third lowest for middle school.
As per district-level UDISE data from 2021-22, while primary and upper-primary pupil-teacher ratios are generally high across the board, South West Delhi has the lowest secondary pupil-teacher ratio at 23 compared to the highest at 31 in North East, and New Delhi district has the lowest ratio for higher secondary at 17 compared to North East Delhi’s 26.
North Delhi has the highest dropout rates for secondary students at 20.5%, followed by East at 8% and Central at 7.6%.