© The Indian Express Pvt Ltd

 The Narendra Modi-headed National Democratic Alliance (NDA) government will end its second term with overall public debt in excess of 80% of India’s gross domestic product (GDP) at current market prices.
All new governments, including those starting fresh innings, carry legacy burdens inherited from their predecessors. It would be no different for the next government taking over post the April-May 2024 national elections.
The Narendra Modi-headed National Democratic Alliance (NDA) government will end its second term with overall public debt in excess of 80% of India’s gross domestic product (GDP) at current market prices.
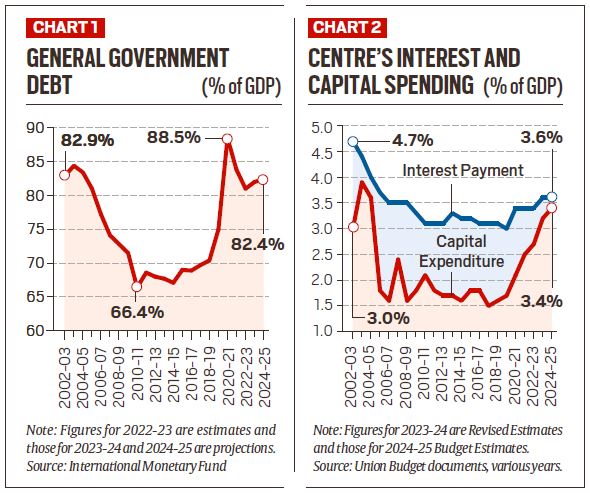
According to International Monetary Fund (IMF) data, general government debt – the combined domestic and external liabilities of both the Centre and the states – touched 84.4% of GDP in 2003-04, the last year of the earlier NDA government under Atal Bihari Vajpayee.
That ratio fell to a low of 66.4% in 2010-11 during the Congress-led United Progressive Alliance (UPA) regime. It rose gradually to 67.7% in 2013-14 and 70.4% in 2018-19, at the end of the UPA’s tenure and the Modi government’s first term respectively.
The Modi government’s second innings saw the debt-GDP ratio soar to 75% in 2019-20 and peak at 88.5% in 2020-21, before easing to 83.8% and 81% in the following two fiscal years (April-March). The IMF has projected the ratio at 82% in the current fiscal and 82.4% for 2024-25, which is still close to the high levels of the early 2000s (chart 1).
 Government debt and capital spending.
What public debt entails
Government debt is basically the outstanding domestic and foreign loans raised by the Centre and states – plus other liabilities, including against small savings schemes, provident funds and special securities issued to the Food Corporation of India, fertiliser firms and oil marketing companies – on which they have to pay interest and the principal amounts borrowed.
As per the Fiscal Responsibility and Budget Management (FRBM) law, which the Vajpayee-headed NDA government had enacted in 2003, the general government debt was supposed to be brought down to 60% of GDP by 2024-25. The Centre’s own total outstanding liabilities were not to exceed 40% within that time schedule.
The Union Budget papers for various years, however, reveal the Centre’s outstanding debt falling from 50.5% of GDP in 2013-14 to 48.1% in 2018-19 at the end of the Modi government’s first term. Subsequently, it shot up to 50.7% in 2019-20 and 60.8% in 2020-21, before marginally dipping to 55.9% in 2022-23, 56.9% in 2023-24 and a budgeted 56% in 2024-25. That’s well above the original 40% target.
In absolute terms, the Centre’s total liabilities has more than doubled from Rs 90.84 lakh crore to Rs 183.67 lakh crore between 2018-19 and 2024-25. The previous doubling, from Rs 45.17 lakh crore in 2011-12, took seven years, one year longer.
The main result of debt levels building up is the Centre’s interest payments: Chart 2 shows a decline in the interest-to-GDP ratio from a high of 4.7% in 2002-03 to 3.1% by 2010-11. The ratio more or less stabilized at 3-3.1% till 2019-20, before surging to 3.4% in 2020-21 and 3.6% in the current and ensuing fiscals.
Why has debt spiraled?
The most obvious reason is the Covid-induced disruptions that forced governments to borrow more – to fund additional public health and social safety net expenditure requirements – amid a drying up of revenues.
The combined gross fiscal deficit of the Centre and the states – the gap between their total spending and revenue receipts – went up from 5.8% and 7.2% of GDP in 2018-19 and 2019-20 respectively, to 13.1% and 10.4% in the next two fiscals. The Centre’s fiscal deficit alone increased from 3.4% of GDP in 2018-19 to 4.6% in 2019-20, 9.2% in 2020-21 and 6.8% in 2021-22.
India was no exception though. Most countries sought to mitigate the impact of the pandemic through fiscal stimulus and relief programmes. General government debt climbed from 108.7% of GDP in 2019 to 133.5% in 2020 and 121.4% in 2022 for the US; from 97.4% to 115.1% and 111.7% for France; from 85.5% to 105.6% and 101.4% for the United Kingdom; and from 60.4% to 70.1% and 77.1% for China during these years. Some had turned on the fiscal taps even after the 2007-08 global financial crisis; the US had a debt-GDP ratio of just 64.6% in 2007!
The Modi government, apart from spending more on income and consumption support schemes, also stepped up public investments in roads, railways and other infrastructure. The Centre’s capital expenditure, as seen from chart 2, dropped from 3.9% to 1.5% of GDP between 2003-04 and 2017-18. It revived significantly thereafter to reach 3.2% in 2023-24 and 3.4% in the Interim Budget for 2024-25.
All these, of course, widened the deficits and only added to debt.
How can debt be reined in?
The FRBM Act envisaged limiting the Centre’s gross fiscal deficit to 3% of GDP by 2020-21. That target, and also that of government debt, has since practically been thrown out of the window.
The Modi government has opted for a new broad “glide path” of fiscal consolidation. This one, announced in the Finance Minister Nirmala Sitharaman’s Union Budget speech for 2021-22, aims to attain a fiscal deficit-to-GDP ratio of “below 4.5%” by 2025-26. But given the high post-pandemic starting points in 2020-21 and 2021-22, the deficit ratios of 6.4%, 5.8%, 5.1% (budget estimate), and “below 4.5%” for the following four years amount to fairly sharp reductions.
While fiscal consolidation can ensure a check on borrowings and not too much being added to the stock of government debt relative to GDP – the IMF has warned against it crossing the 100% mark – there are two other routes as well for bringing the latter down. That would involve what one may call the denominator effect.
Government debt and fiscal deficits are usually quoted as ratios to GDP at current market prices. That being so, high nominal GDP growth – the denominator rising faster than the numerator – can go some way in solving the government’s debt problem. GDP growth, in turn, can come from both real output increases and inflation.
The second and third way to drive down the government debt-to-GDP ratio is, then, to “grow” or “inflate” it away. This actually happened during 2003-04 to 2010-11 when general government debt, as already noted, plunged from 84.4% to 66.4% of GDP. That period, incidentally, also witnessed an average annual GDP growth of 7.4% in real and 15%-plus in nominal terms after adding inflation.
India probably needs a combination of both fiscal consolidation and growth (from output more than inflation) to deal with its current debt woes, which are no less a legacy of Covid.