© The Indian Express Pvt Ltd

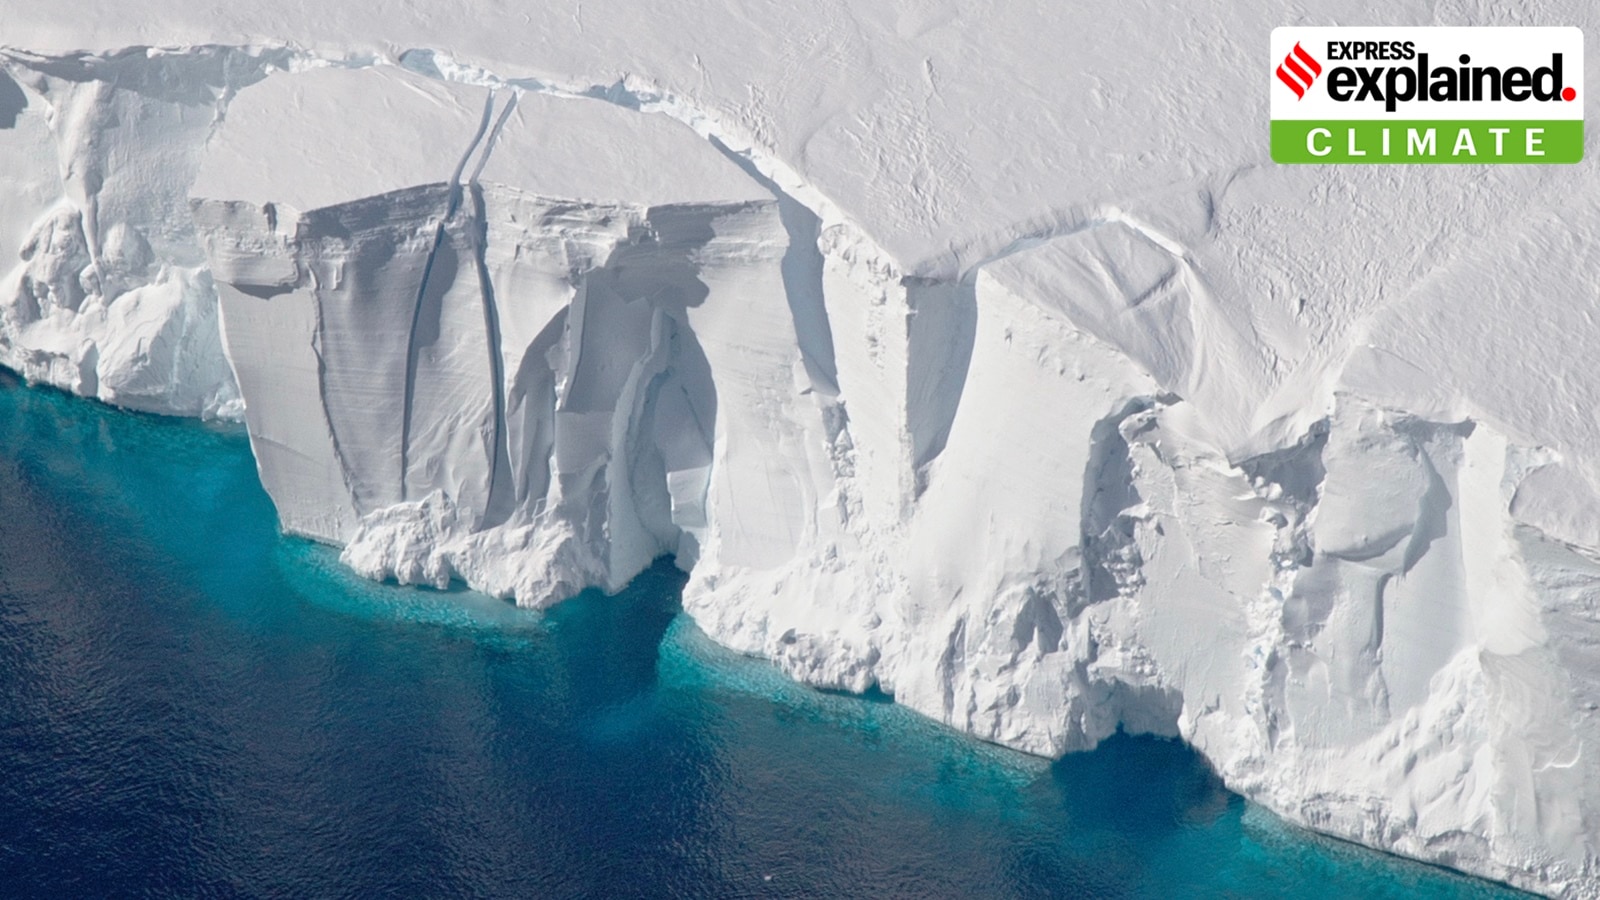 The 200-foot-tall (60-meter-tall) front of the Getz Ice Shelf in Antarctica is scored with cracks where icebergs are likely to break off, or calve, in this 2016 photo. Credit: NASA/GSFC/OIB
The new annual State of the Climate report, published on Tuesday (March 19), by the World Meteorological Organisation (WMO) found that 2023 was the hottest year on record. Numerous records for indicators of the climate system, including greenhouse gas levels (GHGs), surface temperatures, ocean heat, sea level rise, Antarctic sea ice cover, glacier retreat, etc., were broken, the report added.
Here are six figures that show how these indicators have changed over time and what they tell us about the planet’s present condition.
GREENHOUSE GASES
The unprecedented levels of GHGs in the atmosphere are the main culprit behind the rapid warming of the planet. Gases such as carbon dioxide, methane, and nitrous oxide trap the incoming solar radiation in the atmosphere and contribute to global warming. The concentration of aforementioned GHGs reached record-high observed levels in 2022 — the latest year for which consolidated global values are available (1984–2022) — according to the WMO report.
 Top row: Monthly globally averaged mole fraction (measure of atmospheric concentration), from 1984 to 2022, of (a) CO2 in parts per million, (b) CH4 in parts per billion and (c) N2 O in parts per billion. Bottom row: the growth rates representing increases in successive annual means of mole fractions for (d) CO2 in parts per million per year, (e) CH4 in parts per billion per year and (f) N2O in parts per billion per year.
SURFACE TEMPERATURE
The global average near surface temperature for 2023 spiked to 1.45 degree Celsius — the highest ever on record — above the pre-industrial levels. Although the rise in GHG concentrations in the atmosphere is the primary reason for soaring global temperatures, the onset of El Niño last year also contributed to the increase in mercury.
El Niño refers to an abnormal warming of surface waters in the equatorial Pacific Ocean. It increased the likelihood that temperature records would be broken, and there would be more extreme heat in many parts of the world and the ocean.
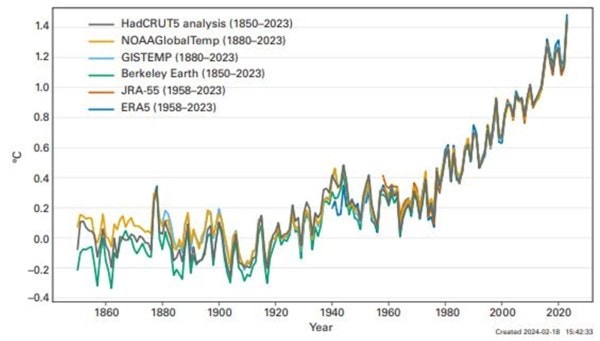 Annual global mean temperature anomalies (relative to 1850–1900) from 1850 to 2023. Data are from six data sets as indicated in the legend. Source: WMO
OCEAN HEAT CONTENT
As the oceans have absorbed nearly 90 per cent of the extra heat trapped by GHGs since 1971, they steadily become warmer and their heat content has increased.
In 2023, the ocean heat content (OHC) — the total amount of heat stored by the oceans — reached its highest level in the 65-year observational record, according to the report.
 Global ocean heat content (OHC) anomalies relative to the 2005–2021 average for the 0–2000 m depth layer 1960–2023. Ensemble mean time series and ensemble standard deviation (2-standard deviations, shaded) updated from von Schuckmann et al. (2023) (orange). Updated from Cheng et al. (red) 2017. From Minière et al. 2023 (blue). Updated from Ishii et al. 2017 (green). Source: Mercator Ocean international and WMO
MARINE HEAT WAVES
Due to warmer temperatures, the global ocean experienced an average daily marine heatwave (MHWs) coverage of 32%, well above the previous record of 23% in 2016, the report added. MHWs occur when the surface temperature of a particular region of the sea rises to 3 or 4 degree Celsius above the average temperature for at least five days.
 (a) Global map showing the highest MHW category experienced at each pixel over 2023 (reference period 1982–2011). Light grey indicates that no MHW occurred in a pixel over the entire year; (b) Stacked bar plot showing the percentage of the surface of the ocean experiencing an MHW on any given day of the year; (c) Stacked bar plot showing the cumulative number of MHW days averaged over the surface of the ocean. (d) Stacked bar plot showing the total percentage of the surface of the ocean that experienced a MHW from 1982 to present. Source: Robert Schlegel and WMO
ANTARCTIC SEA-ICE EXTENT
Antarctic sea-ice extent plummeted to 1.79 million km2 in February 2023 — a new record low since the satellite era began in 1979. The extent remained at a record low for the time of year from June till early November, according to the WMO report.
“The annual maximum in September was 16.96 million km2, roughly 1.5 million km2 below the 1991–2020 average and 1 million km2 below the previous record low maximum,” the report said.
 Daily Arctic sea-ice extent from January through December, showing 2023 (red line) against the climate normal (1991–2020, dark blue) and the record highest and lowest extents for each day (mid blue). Individual years are shown in light blue. Source: Data and map from the U.S. National Snow and Ice Data Center, and WMO
GLACIER
In the hydrological year 2022-2023, the global set of reference glaciers suffered the largest loss of ice on record. Glaciers in North America and Europe were particularly impacted.
According to the WMO report, the annual mass balance — the amount of mass gained or lost by the glacier and expressed in metres of water equivalent (m w.e.) — of the reference glaciers dropped to a new low in 2022-2023, which was –1.2 m w.e.
 Annual mass balance of reference glaciers with more than 30 years of ongoing glaciological measurements. Annual mass change values are given on the y-axis in the unit meter water equivalent (m w.e.) which corresponds to tonnes per square meter (1000 kg·m-2). Source: WGMS and WMO