© The Indian Express Pvt Ltd

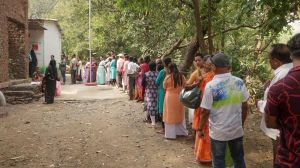
 The first and foremost target was improving the Sex Ratio at Birth (ratio of male to female births) in select critical districts. (Express file photo)
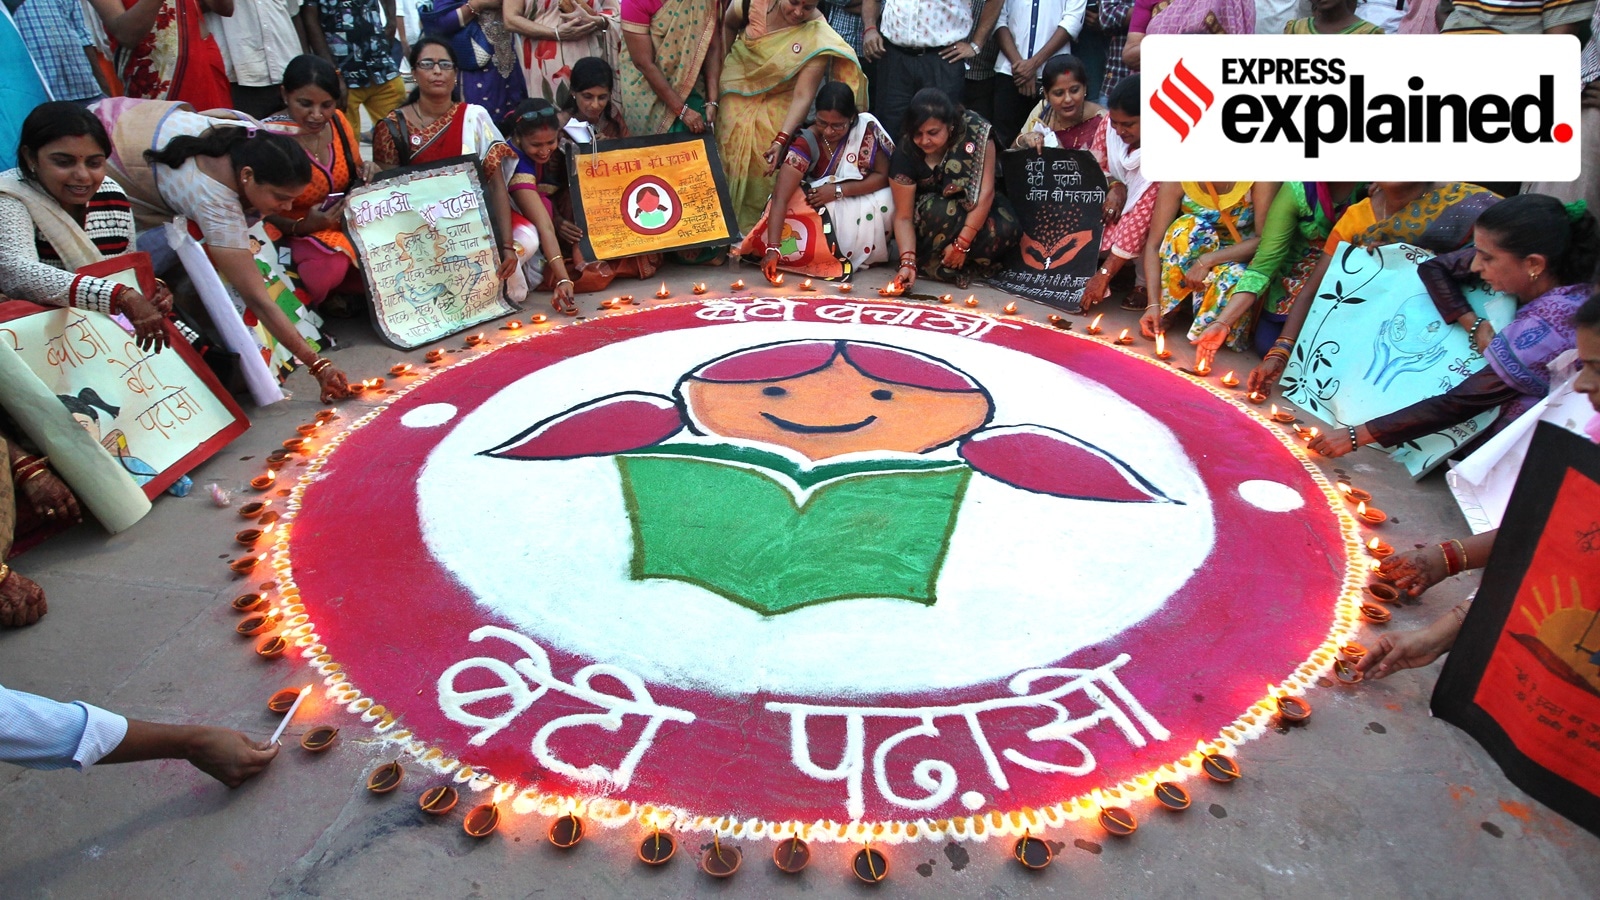
Exactly a decade ago, on January 22, 2015, Prime Minister Narendra Modi launched the Beti Bachao Beti Padhao (BBBP) program to arrest the decline in the child sex ratio.
Initially planned for 100 districts, it was expanded to 61 additional districts in 2015-16 and later to all 640 districts of the country.
Among its objectives were preventing gender-biased sex selection and ensuring the survival, education and empowerment of the girl child.
It set several targets concerning the nutritional status of girls, their attendance in schools, the provision of adequate infrastructure in schools and so on. This was to be done through publicity campaigns, inspections and raids to stop the illegal detection of pregnancy in clinics and other measures. Here is where key indicators stand:
1. Sex ratio at birth: improves in some states, worsens in others
The first and foremost target was improving the Sex Ratio at Birth (ratio of male to female births) in select critical districts by 2 points each year.
While district-level SRB data is not available in the public domain, the Economic Survey for 2023-24 noted that the national SRB improved from 918 per 1000 males (2014-15) to 930 (2023-24, provisional), citing data from the Health Management Information System (HMIS) of the Ministry of Health & Family Welfare. HMIS data is also not publicly available.
Separately, data from the Sample Registration System (SRS) that covers bigger states and Union Territories (with a population of 10 million and above) show the SRB at the all-India level increased by 9 points between 2014-16 and 2018-20, the latest years for which data is available. Of 22 states having SRS data available for 2018-20, the sex ratio at birth increased in 13 states, declined in nine states and remained the same in one state (Maharashtra). The maximum increase – of 54 points– was recorded in Rajasthan, followed by Haryana (38 points), Himachal Pradesh (33 points) and Gujarat (29 points).
Among the states which saw a fall in SRB, Odisha recorded the maximum decline of 23 points, followed by Karnataka (19 points) and Bihar (13 points).
Sex Ratio at Birth
| States | 2014-16 | 2018-20 |
|
Andhra Pradesh
|
913 | 926 |
| Assam | 896 | 923 |
| Bihar | 908 | 895 |
|
Chhattisgarh
|
963 | 958 |
| Delhi | 857 | 860 |
| Gujarat | 848 | 877 |
| Haryana | 832 | 870 |
|
Himachal Pradesh
|
917 | 950 |
|
Jammu & Kashmir
|
906 | 921 |
| Jharkhand | 918 | 914 |
| Karnataka | 935 | 916 |
| Kerala | 959 | 974 |
|
Madhya Pradesh
|
922 | 919 |
| Maharashtra | 876 | 876 |
| Odisha | 948 | 925 |
| Punjab | 893 | 897 |
| Rajasthan | 857 | 911 |
| Tamil Nadu | 915 | 917 |
| Telangana | 901 | 892 |
| Uttarakhand | 850 | 844 |
|
Uttar Pradesh
|
882 | 905 |
| West Bengal | 937 | 936 |
| India | 898 | 907 |
Source: Sample Registration System report; and Women and Men in India, 2023
2. Gender gap in under-five child mortality minimised
The second target was to reduce gender differentials in under-five child mortality (the probability a newborn would die before reaching exactly five years of age, expressed per 1,000 live births).
In 2014, just before the launch of the BBBP, the under-five mortality rate at the national level was 49 for girls and 42 for boys — a gender differential of 7 points. The target aimed to reduce it by 1.5 points per year. By 2020, this difference was 2 points (girls at 33 and boys at 31). However, the progress varies across the states.
Of 22 states and UTs for which data is available, the gender differential in the under-five child mortality rate is negative in Himachal Pradesh, Kerala, Delhi, Gujarat, and Madhya Pradesh – meaning the rate is lower for girls than boys. In three states it is equal. In Jammu & Kashmir, Punjab, Assam, Bihar, Rajasthan and Chhattisgarh, it is higher as compared to the national average.
Gap between female and male Under-five Child Mortality rate
| States | 2014 | 2020 |
| Andhra Pradesh | 2 | 1 |
| Assam | 7 | 5 |
| Bihar | 9 | 5 |
| Chhattisgarh | 11 | 8 |
| Delhi | 5 | -3 |
| Gujarat | 3 | -2 |
| Haryana | 6 | 0 |
| Himachal Pradesh | 2 | -9 |
| Jammu & Kashmir | 4 | 3 |
| Jharkhand | 8 | 2 |
| Karnataka | 3 | 1 |
| Kerala | 3 | -8 |
| Madhya Pradesh | 10 | -1 |
| Maharashtra | 1 | 1 |
| Odisha | 3 | 2 |
| Punjab | 7 | 4 |
| Rajasthan | 10 | 6 |
| Tamil Nadu | -1 | 0 |
| Telangana | 3 | 1 |
| Uttarakhand | 7 | 1 |
| Uttar Pradesh | 11 | 1 |
| West Bengal | 4 | 0 |
| India | 7 | 2 |
Source: Calculated from SRS reports for respective years.
3. Increase in institutional births
The third target was to increase institutional deliveries by at least 1.5 per cent per year. Data from the National Family Health Surveys show that the proportion of institutional deliveries has increased over the years.
When BBBP was launched, 78.9 per cent of all births took place in institutions like hospitals and community health centres (NFHS-4 data for 2015-16). In 2019-21, this figure had increased by 9.7 percentage points to 88.6 per cent (NFHS-5). Almost all the states saw an increase in institutional deliveries.
Institutional deliveries (%)
| States | NFHS-4 (2015-16) |
NFHS-5 (2019-21) |
Change |
|
Andaman & Nicobar Islands
|
96.4 | 98.9 | 2.5 |
|
Andhra Pradesh
|
91.5 | 96.5 | 5 |
|
Arunachal Pradesh
|
52.2 | 79.2 | 27 |
| Assam | 70.6 | 84.1 | 13.5 |
| Bihar | 63.8 | 76.2 | 12.4 |
| Chandigarh | 91.6 | 96.9 | 5.3 |
| Chhattisgarh | 70.2 | 85.7 | 15.5 |
|
Dadra & Nagar Haveli and Daman & Diu
|
# | 96.5 | |
| Delhi | 84.4 | 91.8 | 7.4 |
| Goa | 96.9 | 99.7 | 2.8 |
| Gujarat | 88.5 | 94.3 | 5.8 |
| Haryana | 80.4 | 94.9 | 14.5 |
|
Himachal Pradesh
|
76.4 | 88.2 | 11.8 |
|
Jammu & Kashmir
|
# | 92.4 | |
| Jharkhand | 61.9 | 75.8 | 13.9 |
| Karnataka | 94 | 97 | 3 |
| Kerala | 99.8 | 99.8 | 0 |
| Ladakh | # | 95.1 | |
|
Lakshadweep
|
99.3 | 99.6 | 0.3 |
|
Madhya Pradesh
|
80.8 | 90.7 | 9.9 |
| Maharashtra | 90.3 | 94.7 | 4.4 |
| Manipur | 69.1 | 79.9 | 10.8 |
| Meghalaya | 51.4 | 58.1 | 6.7 |
| Mizoram | 79.7 | 85.8 | 6.1 |
| Nagaland | 32.8 | 45.7 | 12.9 |
| Odisha | 85.3 | 92.2 | 6.9 |
| Puducherry | 99.9 | 99.6 | -0.3 |
| Punjab | 90.5 | 94.3 | 3.8 |
| Rajasthan | 84 | 94.9 | 10.9 |
| Sikkim | 94.7 | 94.7 | 0 |
| Tamil Nadu | 98.9 | 99.6 | 0.7 |
| Telangana | 91.5 | 97 | 5.5 |
| Tripura | 79.9 | 89.2 | 9.3 |
| Uttarakhand | 68.6 | 83.2 | 14.6 |
|
Uttar Pradesh
|
67.8 | 83.4 | 15.6 |
| West Bengal | 75.2 | 91.7 | 16.5 |
| India | 78.9 | 88.6 | 9.7 |
NFHS data
4. Rising antenatal checkups
The BBBP also envisioned a minimum 1% increase per year in the 1st trimester antenatal check (ANC). This is necessary for bringing down maternal mortality incidences. At the time of the launch of the BBBP, only 58.6 percent of mothers had an antenatal check up in the first trimester in 2015-16 (NFHS-4). However, since then, this figure has increased nationally.
At the sub-national level, barring a few states like Punjab and Chhattisgarh, it has increased. As per the data available in the NFHS-5, 70 per cent of mothers had an antenatal check up in the first trimester during 2019-21. As per the government’s Guidelines for Pregnancy Care, the first visit or registration of a pregnant woman for ANC should take place as soon as the pregnancy is suspected.
Mothers who had antenatal check-up in the first trimester (%)
| States | NFHS-4 (2015-16) |
NFHS-5 (2019-21) |
| Andaman & Nicobar Islands | 68.4 | 77.1 |
| Andhra Pradesh | 82.3 | 81.7 |
| Arunachal Pradesh | 36.9 | 53.1 |
| Assam | 55.1 | 63.8 |
| Bihar | 34.6 | 52.9 |
| Chandigarh | 67.4 | 82.3 |
| Chhattisgarh | 70.8 | 65.7 |
|
Dadra & Nagar Haveli, Daman & Diu
|
# | 77.7 |
| Delhi | 63 | 76.4 |
| Goa | 84.4 | 70.3 |
| Gujarat | 73.8 | 79.3 |
| Haryana | 63.2 | 85.2 |
| Himachal Pradesh | 70.5 | 72.4 |
| Jammu & Kashmir | # | 86.6 |
| Jharkhand | 52 | 68 |
| Karnataka | 65.9 | 71 |
| Kerala | 95.1 | 93.6 |
| Ladakh | # | 85.7 |
| Lakshadweep | 90.6 | 99.6 |
| Madhya Pradesh | 53 | 75.4 |
| Maharashtra | 67.6 | 70.9 |
| Manipur | 77 | 79.9 |
| Meghalaya | 53.3 | 53.9 |
| Mizoram | 65.6 | 72.7 |
| Nagaland | 24.7 | 49.5 |
| Odisha | 64 | 76.9 |
| Puducherry | 80.6 | 82.4 |
| Punjab | 75.6 | 68.5 |
| Rajasthan | 63 | 76.3 |
| Sikkim | 76.2 | 63.7 |
| Tamil Nadu | 64 | 77.4 |
| Telangana | 83.1 | 88.5 |
| Tripura | 66.4 | 63.2 |
| Uttarakhand | 53.5 | 68.8 |
| Uttar Pradesh | 45.9 | 62.5 |
| West Bengal | 54.9 | 72.6 |
| India | 58.6 | 70 |
Source: Women and Men in India, 2023
5. Increase enrollment of girls in secondary education
One of the targets of the BBBP was to increase the enrollment of girls in secondary education to 82% by 2018-19. The figure stood at 75.5 per cent during 2014-15. The scheme has not been able to achieve this target, as the enrollment ratio was recorded at 76.9 per cent in 2018-19.
Gross Enrollment Ratio in Secondary (IX-X) Education
| Years | Gross Enrollment Ratio (%) |
| 2013-14 | 73.5 |
| 2014-15 | 75.7 |
| 2015-16 | 77 |
| 2016-17 | 76.2 |
| 2017-18 | 76.2 |
| 2018-19 | 76.9 |
| 2019-20 | 77.8 |
| 2020-21 | 79.5 |
| 2021-22 | 79.4 |
Source: Women and Men in India, 2023