Why in the news?
With the World Bank raising its threshold poverty line to $3 a day (daily consumption of less than $3) from the earlier $2.15 a day, the extreme poverty rate for India declines sharply to 5.3 per cent in 2022-23 from 27.1 per cent in 2011-12. In absolute terms, people living in extreme poverty fell from 344.47 million to just 75.24 million, latest data from the World Bank shows. In this context, let’s know about the concept of poverty line and status of poverty in India.
Key Takeaways :
1. Poverty line is the level of income used as a cut-off point for deciding who is poor in any economy. It represents the minimum income level necessary to meet basic needs, and varies across countries depending on their overall economic conditions. It is important to note here that the context (both time period and location) is critical to arriving at a meaningful poverty line.
2. Governments, especially in developing and poor countries, want to identify the extent of poverty in their countries. This has two uses.
📌One, to help them gauge the extent of poverty and shape welfare policies for the poor.
📌 The second use is for governments, policymakers and analysts to understand whether a set of policies has actually worked over time to reduce poverty and improve wellbeing.
Story continues below this ad
3. Historically, India had been a leader in poverty estimation and India’s poverty line methodology and data collection influenced the rest of the world in how to study poverty.
4. Notably, India’s last officially recognised poverty line was in 2011-12. It was built on a 2009 formula suggested by Tendulkar committee. Since then, there has been no update on the method.
5. In 2014, a committee led by former RBI Governor C Rangarajan was commissioned to provide a new method, but its recommendation was never officially accepted. Since then, India has increasingly used either the National Institution for Transforming India (NITI Aayog) multidimensional poverty index (which is fundamentally different in how it measures poverty) or relied on the World Bank’s poverty line.
6. India’s own (domestically formulated) poverty line in 2009, before the Tendulkar recommendation, was Rs 17 a day per person for urban areas and Rs 12 a day per person for rural areas.
Story continues below this ad
7. In 2009, Tendulkar raised the poverty line to Rs 29 per day per person in urban areas and Rs 22 per day per person in rural areas, and later to Rs 36 and Rs 30, respectively, in 2011-12.
8. In 2014, Rangarajan recommended raising the domestic poverty line to Rs 47 per person per day in urban areas and Rs 33 in rural areas.
World Bank’s Poverty Line
9. The first-ever poverty line was set at a dollar a day. According to the World Bank, “In 1990, a group of independent researchers and the World Bank examined national poverty lines from some of the poorest countries in the world and converted those lines into a common currency by using purchasing power parity (PPP) exchange rates.
The PPP exchange rates are constructed to ensure that the same quantity of goods and services are priced equivalently across countries. Once converted into a common currency, they found that in six of these very poor countries around the 1980s the value of the national poverty line was about $1 per day per person (in 1985 prices). This formed the basis for the first dollar-a-day international poverty line.”
Story continues below this ad
10. Over time, as prices went up in every country, the WB had to raise its poverty line. In June, they have now raised it to $3 a day.
What insights has the latest World Bank report provided on poverty in India?
11. Despite the World Bank revising its extreme poverty line to adjust for global inflation in 2021 prices, India seems to have fared well, with the poverty numbers holding good. At $3 a day threshold, India’s extreme poverty rate for 2022-23 rises from 2.3 per cent (at a poverty line of $2.15 a day) to 5.3 per cent, the World Bank estimates.
12. Adjusting the earlier $2.15-per-day line for domestic inflation from 2017 to 2021, according to sources, brings the threshold poverty line to roughly $2.60—still lower in real terms than the new $3 a day benchmark.
13. The share of Indians living below the revised lower-middle-income category (LMIC) poverty line of $4.20 per day (from $3.65 in 2017 prices) also fell from 57.7 per cent in 2011-12 to 23.9 per cent in 2022-23. In absolute numbers, people living under the revised LMIC poverty line dips from 732.48 million to 342.32 million in a period of 11 years.
Story continues below this ad
14. The World Bank estimates India’s population at 1438.07 million in 2023, using its World Development Indicators database and the official Household Consumption Expenditure Survey.
BEYOND THE NUGGET: Global Multidimensional Poverty Index and National Multidimensional Poverty Index
1. The 2024 Multidimensional Poverty Index was published on 17th October on the International Day for the Eradication of Poverty by the Oxford Poverty and Human Development Initiative (OPHI) and the Human Development Report Office of the United Nations Development Programme (UNDP). It was first launched in 2010.
2. Traditionally, poverty is calculated based either on income levels or, if income data are not available, on expenditure levels. The so-called “poverty lines” are actually expenditure levels that are considered minimum enough for someone to be called poor.
3. The MPI approaches poverty differently. It aims to push forward the goal of Sustainable Development Goal (SDG)- 1— ending poverty in all its forms everywhere —and measures interconnected deprivations across indicators related to SDGs 1, 2, 3, 4, 6, 7, and 11.
Story continues below this ad
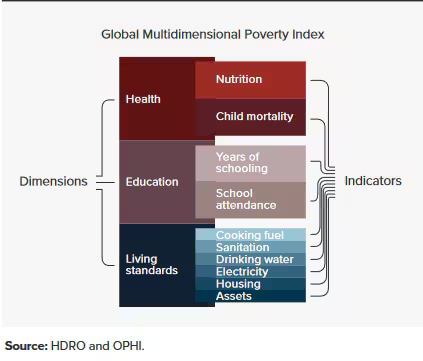
4. The Global MPI uses 10 indicators covering three main areas. These three dimensions have one-third weight each in the final index.
(i) Health: It includes nutrition and child & adolescent mortality indicators.
(ii) Education: It includes years of schooling and school attendance indicators.
(iii) Standard of living: It includes six household-specific indicators: housing, household assets, type of cooking fuel, access to sanitation, drinking water, and electricity.
Story continues below this ad
5. The report pointed out that the countries with the lowest Human Development Index (HDI) values tend to have the highest MPI values and the highest proportion of people living in poverty, but a large share of people also reside in medium HDI countries like India.
6. The five countries with the largest number of people living in poverty are India (234 million), which is medium HDI, and Pakistan (93 million), Ethiopia (86 million), Nigeria (74 million) and the Democratic Republic of the Congo (66 million), all low HDI.
7. India’s MPI value is 0.069. The lower MPI values represent a better performance regarding multidimensional poverty. The higher MPI value is of Niger, 0.601 and the lowest is of Serbia with an MPI value of 0.
National Multidimensional Poverty Index
1. NITI Aayog, the apex public policy think tank of the Indian government, in collaboration with the UNDP and OPHI, developed a National Multidimensional Poverty Index to monitor multidimensional poverty at national, state, and district levels in the country.
Story continues below this ad
2. It comprises three equally weighted dimensions – health, education, and standard of living. These three dimensions are represented by 12 indicators, namely nutrition, child and adolescent mortality, maternal health, years of schooling, school attendance, cooking fuel, sanitation, drinking water, electricity, housing, assets, and bank accounts.
Post Read Questions
(1) In a given year in India, official poverty lines are higher in some States than in others because (2019)
(a) poverty rates vary from State to State
(b) price levels vary from State to State
(c) Gross State Product varies from State to State
(d) quality of public distribution varies from State to State
(2) The Multi-dimensional Poverty Index developed by Oxford Poverty and Human Development Initiative with UNDP support covers which of the following? (UPSC CSE 2012)
1. Deprivation of education, health, assets and services at household level
2. Purchasing power parity at national level
3. Extent of budget deficit and GDP growth rate at national level
Select the correct answer using the codes given below:
(a) 1 only
(b) 2 and 3 only
(c) 1 and 3 only
(d) 1, 2 and 3
Subscribe to our UPSC newsletter. Stay updated with the latest UPSC articles by joining our Telegram channel – Indian Express UPSC Hub, and follow us on Instagram and X. 🚨 Click Here to read the UPSC Essentials magazine for June 2025. Share your views and suggestions in the comment box or at manas.srivastava@indianexpress.com🚨