Opinion No proof required: Central bank governor, a no-mistake job
Given long and variable lags, unknown base effects, and confounding inflation expectations, can a monetary official ever get a policy action wrong?


 There are a plethora of CPI inflation indices: Headline, food, ex-food, core etc. For the purpose of disentangling the causes according to Rajan’s formulation, let me offer an additional index: Basic CPI inflation or overall CPI minus inflation due to external shocks (oil) and changes in taxation.
Since my article a month ago (‘Why inflation fell’, The Indian Express, August 26), headline consumer price index data for August has been released and, to the surprise of many, it registered a second consecutive 3.6-3.7 per cent headline inflation print.
As we await the RBI decision on monetary policy on September 29, it is important that we have a correct understanding of what has caused inflation to fall so rapidly. Citing an RBI study, Governor Raghuram Rajan alluded to three big possible causes for CPI inflation to decline: “The good inflation news follows from a combination of good food management by the government, good luck because of external factors such as lower crude prices, and monetary policy”.
In this article, I want to look at the individual contributions of these three over the last three years. But how do we measure inflation? There are a plethora of CPI inflation indices: Headline, food, ex-food, core etc. For the purpose of disentangling the causes according to Rajan’s formulation, let me offer an additional index: Basic CPI inflation or overall CPI minus inflation due to external shocks (oil) and changes in taxation.
The oil price shock is a biggie, as are the service tax increases since June. The service tax increased by a rather large 13.2 per cent (from 12.36 to 14 per cent). This obviously has an effect on prices, and year-on-year calculations, and it would be a mistake to construe tax-induced inflation as constituting structural inflation, which anyone should be worried about, especially the RBI. While tax increases, ceteris paribus, decrease the fiscal deficit, the RBI has been emphasising the inflationary effects of fiscal deficits for decades. I have yet to find any significant effect of fiscal deficits on inflation (it is an outcome variable, not a cause), but that can be debated another day. The fact remains that tax increases should be separated from underlying or structural inflation — just like oil price changes (declines) should also be eliminated while discussing structural inflation.
My suggested index of “core” inflation, or basic inflation, is the following: It is inflation excluding food (weight = 45.86 per cent), fuel and light (mostly government administered prices for kerosene, electricity etc; weight = 6.84 per cent), consumer prices of petrol and diesel (in transport and communication; weight = 2.19 per cent), and CPI for “pan, tobacco and intoxicants” (weight = 2.38 per cent). The reason for excluding CPI for tobacco etc is because this sector is also hugely affected by tax changes. Hence, the basic CPI is sensitive to changes in the prices of housing, education, health, clothing, footwear etc. The total weight for these items is 42.73 per cent, almost equal to that of food. Basic and food inflation together constitute “true” CPI inflation.
The trend in these two constituents of inflation — basic and food — can help assess the contribution of the three “Rajan factors” — food management, oil prices, and monetary policy — to the decline in CPI inflation. After averaging 9.8 per cent for the previous seven years (2007-2013), headline CPI inflation fell to 3.7 per cent for two successive months, July and August 2015. There is little doubt that CPI inflation has fallen, and fallen sharply.
While the prices of oil and commodities like metals do affect the WPI, the only direct effect of their decline on the CPI is via the components that have been excluded from the basic CPI. In any case, petrol prices for the CPI are only down 11 per cent from last August despite the price of crude oil having reduced by half since then.
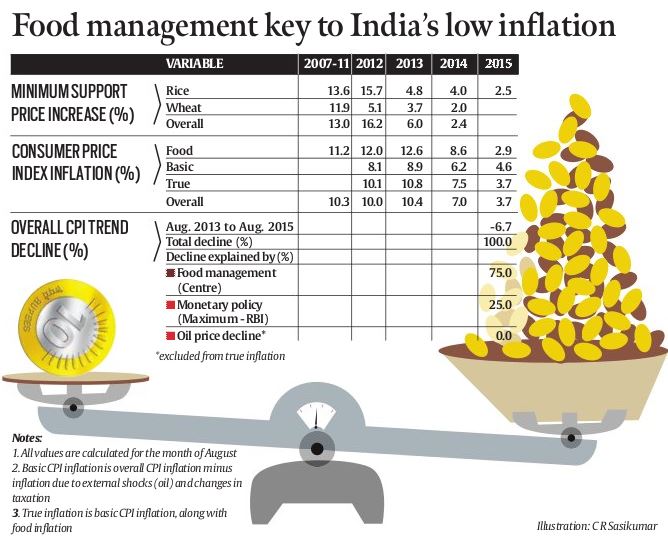
The real story of inflation decline is that of food; in turn, this has been caused — with a lag — by the toning down of minimum support prices (MSPs). The pace of MSP increases started declining from the setting of the winter crop MSP in August 2012. The wheat MSP was announced on August 3, 2012; it was only increased by 5.1 per cent, compared to the 14.7 per cent increase of a year earlier. Interestingly, the MSP for rice does not show this sharp decline — indeed, at 15.7 per cent and announced on June 14, 2012, it was almost double the 8 per cent increase of the year before.
So what happened in the UPA during these two months to cause such a radical shift in MSP policy? When economic historians write about the great inflation decline in India, they will have to credit a certain P. Chidambaram, who assumed the role of finance minister again in July 2012.
Every MSP policy action since the “pioneering” Chidambaram initiative of August 2012 has led to MSPs, and food prices, declining in India. The average MSP increase in 2013 was 6 per cent and 2.4 per cent in 2014. It is likely to be less than 3 per cent in 2015 (once MSPs for the rabi crop are announced). Food inflation has declined from a 12 and 12.6 per cent rate (2012 and 2013) to 8.6 and 2.9 per cent in 2014 and 2015, respectively.
It is hard to argue that monetary policy had anything to do with this supply side decline. But Rajan may have had something to do with Chidambaram’s initiative — he formally joined Chidambaram’s ministry just nine days after the historic MSP decision. There is no way of knowing whether Rajan was consulted by Chidambaram, but what one does know is that, in his last few policy statements, Rajan has been emphatic about the need for MSP prices to be contained — in order to contain headline inflation!
We cannot attribute monetary policy as the cause of food price declines, but we can attribute at least some of the basic inflation decline to the actions of the RBI. Basic inflation declined from 8.1 and 8.9 per cent in 2012 and 2013 to 4.6 per cent in August 2015. Note that service tax increase post May 2015 possibly accounts for about 0.6 percentage points of the decline in basic inflation; that is, basic inflation is at present about 4 per cent.
We can now summarise the role played by Rajan’s three factors in accounting for the great Indian inflation decline. Overall, CPI has declined by 6.7 percentage points since August 2013; true CPI inflation has declined by 7.1 percentage points. Food price decline has been 9.7 percentage points and this has contributed to almost 75 per cent of the decline in true CPI; the maximum share of monetary policy is 25 per cent. Oil prices have a nil share in the true CPI decline.
Note that we have not mentioned base effects even once; nor have we mentioned inflation expectations. Base effects do not enter the above calculation, they cannot for a four-year period. Remember that “base effects” are one of the three most important self-defence tools in a monetary policymaker’s arsenal. The other two are: monetary policy acts with long and variable lags; and, lest we forget, monetary policy needs to anchor all-important inflation expectations. Can any monetary official, anywhere, ever make a mistake?
The writer is chairman, Oxus Investments, and senior India analyst, the Observatory Group, a New York-based macro policy advisory group