Opinion With new consumption survey, the need for new indices
The survey will lead to fresh poverty estimates. It will also have implications for inflation and monetary policy
 The above estimates are tentative and we can have better analysis once the unit-level data is released. (Illustration by CR Sasikumar)

Recently, summary results of the Household Consumption Expenditure Survey (HCES), 2022-23, conducted by the National Sample Survey Office (NSSO) were released. In this context, we discuss three issues here: Trends in poverty; difference between private consumption expenditure of NSSO and the figure provided by the National Accounts Statistics (NAS); and changes in consumption patterns and implications for consumer price index and monetary policy. The HCES 2022-23 has undergone some changes as compared to the previous surveys in consumption expenditure. These are: One, item coverage; two, changes in the questionnaire; three, multiple visits for data collection and computed assisted personal interviews compared to pen and paper interviews. These changes have to be kept in mind while comparing the results of HCES 2022-23 with those of previous surveys.
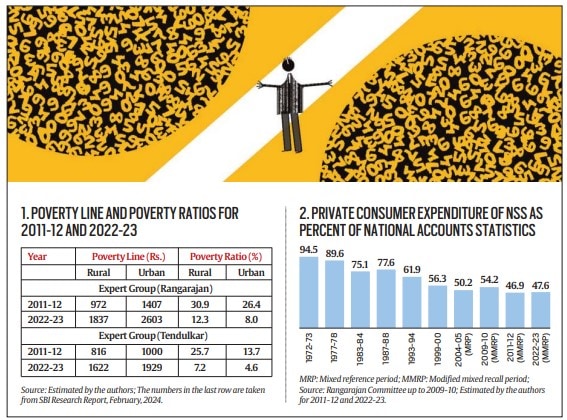
The first issue is to examine the changes in poverty using the new information on consumption expenditure. The poverty lines for 2011-12 based on Expert Group (Tendulkar) methodology were Rs 816 and Rs 1,000 per capita per month respectively for rural and urban areas. An SBI report has estimated poverty ratios in 2022-23 by updating poverty lines. The new updated poverty line is Rs 1,622 in rural areas and Rs 1,929 in urban areas. According to this SBI report, poverty in rural areas declined from 25.7 per cent in 2011-12 to 7.2 per cent in 2022-23 while in urban areas it declined from 13.7 per cent to 4.6 per cent. Using the shares of the rural and urban populations, the total poverty ratio based on the Tendulkar committee methodology comes to 6.3 per cent.
The poverty line for 2011-12 based on Expert Group (Rangarajan) methodology was Rs 972 and Rs 1,407 per capita per month respectively for rural and urban areas. Using CPI, we updated the poverty line which is Rs 1,837 for rural and Rs 2,603 for urban areas in 2022-23. As Table 1 shows, the poverty ratio for rural areas declined from 30.9 per cent in 2011-12 to 12.3 per cent in 2022-23. For urban areas, it declined from 26.4 per cent in 2011-12 to 8 per cent in 2022-23. It may be noted that the poverty ratio derived from the Expert Group (Rangarajan) method is 71 per cent higher in rural areas and 74 per cent higher in urban areas than that derived by using the Expert Group (Tendulkar) method. The overall poverty ratio under the Rangarajan methodology for 2022-23 will be 10.8 per cent. While the poverty ratio is higher under our methodology, the order of decline in percentage points between the two periods is the same under both methodologies in rural areas. But in urban areas, the decline in our methodology is higher.
However, as mentioned above, the data on consumption expenditure in 2022-23 is not strictly comparable to earlier surveys. The comparable data would have probably given much higher poverty figures under the Rangarajan Committee methodology, particularly for urban areas. The above estimates are tentative and we can have better analysis once the unit-level data is released.
The second issue is the alarming difference between the aggregate private consumption expenditure given by the NSSO and the figure provided by the National Accounts Statistics (NAS). What is disturbing is that despite substantial methodological changes to capture private expenditure, the NSS share increased only marginally in 2022-23. These two estimates of consumption (NSS and NAS) do not match in any country; India is no exception. What is perplexing is that the difference in India between the NSS and the NAS consumption is widening over time.
From a difference of less than 10 per cent in the late 1970s, it has come to 53 per cent in 2011-12 (Table 2). This difference declined only marginally to 52 per cent in 2022-23. However, with the continuation of differences of more than 50 per cent, the time has come for a deeper analysis of the factors contributing to the difference. It is too big to be pushed under the carpet. The NSSO Advisory Group must study the problem and come out with possible suggestions for improving the collection of data through both routes. Such a large difference has implications for computing the poverty ratio.
The third issue is the implications of the HCES 2022-23 for the Consumer Price Index (CPI). The latest data reveal that there have been some changes in consumption patterns between 2011-12 and 2022-23. In rural areas, the share of food in monthly per capita expenditure (MPCE) has declined from 52.9 per cent in 2011-12 to 46.4 per cent in 2022-23 — a decline of 6.5 percentage points in 11 years. In urban areas, the share of food in total consumption decreased from 42.6 per cent to 39.2 per cent during the same period — a decline of 3.5 percentage points in 11 years. The share of cereals in average MPCE has shown a significant decline in rural areas from 10.8 per cent in 2011-12 to 4.9 per cent in 2022-23 and 6.7 per cent to 3.6 per cent in urban areas. In food items, the share of fruits, beverages and processed food rose both in rural and urban areas. There is some reduction in the share of vegetables. In non-food items, the shares of toiletries and household items, conveyance and durable goods increased significantly in both rural and urban areas.
What are the implications for the weights of food and non-food items in the CPI and inflation due to these changes in consumer patterns? This new data can help adjust weights in the CPI basket which is currently based on 2011-12 weights. The decline in the weights of food items is a good sign as food prices are volatile and many times higher than those of non-food items. But, the question is whether the present decline in food share is enough to have a significant impact on inflation levels. The food share is still high at 46 per cent and 39 per cent respectively in rural and urban areas. The share of cereals, vegetables and edible oils declined but the share of fruits has increased while the share of egg, fish and meat remains the same. However, a decline in food share will have some impact on inflation. The monetary policy committee will have to work with a new price index.
C Rangarajan is former chairman, Economic Advisory Council to the Prime Minister and former governor, Reserve Bank of India. S Mahendra Dev is former chairman, Commission for Agricultural Costs and Prices, GOI and former vice chancellor, IGIDR, Mumbai