Delhi Model: How AAP govt’s financial health changed in 10 years
On health and education, the AAP nearly dedicates 40% of its Budget – among the highest in the country.
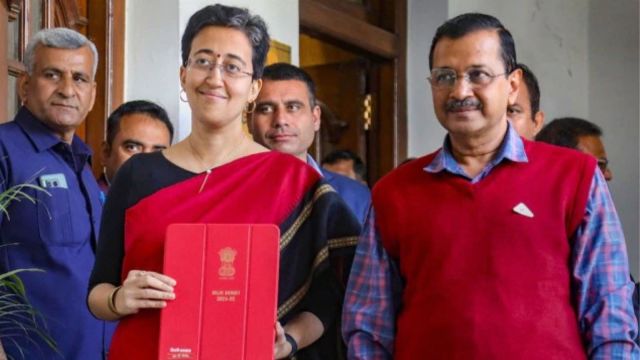 On health and education, AAP nearly dedicates 40% of its Budget — among the highest in the country. (File)
The Delhi government under the AAP, since it came to power in 2015, has remained revenue surplus – a feat not achieved by other states. The government has achieved this despite spending massively on healthcare, education and subsidies.
In its very first Budget, AAP had doubled the expenditure on education and increased spending on healthcare by 45%. When the party first held the reins of Delhi as a majority government in 2015, the budgeted outlay (2015-16) was Rs 37,750 crore. Each year, the Budget grew by nearly Rs 5,000 crore (compared to an annual increase of Rs 1.5 thousand crore in the five years preceding AAP’s rule). In its latest Budget, the AAP government has announced an outlay of Rs 76,000 crore.
On health and education, the AAP nearly dedicates 40% of its Budget – among the highest in the country.
While the debt to Gross domestic product (GDP) ratio in India is 27.5% on an average, for Delhi, it is just 3.9% – among the lowest in the country. Delhi’s inflation-adjusted GDP rose from Rs 4.28 lakh crore in 2014-15 to Rs 6.26 lakh crore in 2022-2023, up by 150%.
The term ‘Delhi Model’ came into being when AAP government’s fiscal and financial health remained intact despite its spending on healthcare, education and subsidies.
However, cracks are now beginning to show.
In October, for instance, AAP sparred with BJP when the latter pointed out that the National Capital Territory (NCT) of Delhi was likely to face its first revenue deficit in 2024-25.
The second controversy arose when AAP sought to borrow Rs 10,000 crore from the National Small Savings Fund (NSSF) for 2024-25, with just a few months left for Assembly elections and the Finance Department internally objected to the same.
The department also flagged that if AAP’s Mukhyamantri Mahila Samman Yojana (giving women non-taxpayers dole of Rs 1,000 every month) is implemented, government expenditure on subsidies, which is 15% of the total Budget now, will go up to 20%.
Currently, the three major subsidies on which the government spends money are – free bus travel for women (around Rs 440 crore), 100% electricity waiver up to 200 units and 50% from 201 units to 400 units (Rs 3,600 crore) and a water subsidy that provides up to 20,000 litres free everyday (Rs 500 crore).
Amid these controversies surrounding the financial health of the government, the AAP has promised free healthcare for its senior citizens and raised the monthly allowance for women to Rs 2,100 if it returns to power.
Here’s how Delhi government’s financial health has changed over the last 10 years.
Increased reliance on NSSF loans, grants-in-aid from Centre
From 2016-17 to 2021-22, NSSF loans received by the Delhi government rose from Rs 2,896 crore to almost Rs 11,000 crore. In fact, the figure crossed Rs 10,000 crore thrice – from 2019-20 to 2021-22.
In 2022-23, the Delhi government borrowed just Rs 3,721 crore. In 2023-24, no money was borrowed but this year again, the government sought Rs 10,000 crore from NSSF.
From Rs 5,588 crore in 2019-20, the capital receipts grew to Rs 15,996 crore – owing to the NSSF loan and a Rs 5,865 crore GST (Goods and Services Tax) compensation. The year after that, the Delhi government received Rs 6,192 crore as GST compensation. The capital expenditure has doubled in just five years, thanks to these two components.
Before GST was implemented, the main source of tax revenue for the Delhi government was VAT (value added tax), which made up for 70% of tax revenues. Today, it accounts for just 12%-14%. In 2015-16, VAT worth Rs 20,245 thousand crore was received – a figure that the GST collections were able to surpass only in 2021-22 (above Rs 22,000 crore).
Another trend is the increasing reliance on grants-in-aid from the Centre. While over 90% of the tax revenue that the Delhi government raised in the last 10 years has been its own, grants from the Union government have risen rapidly as a percentage of the NCT’s GDP.
In 2014-15, grants-in-aid from the Centre accounted for 0.47% of GDP. While it was 0.78% in 2015-16, the figure was 0.46% in 2016-17, 0.32% in 2017-18, and 0.78% in 2018-19, respectively. Things started changing in 2019-20 when grants-in-aid from the Centre accounted for 1.22% of GDP. In 2020-21, the figure was 1.54%. The following year, it was 0.96%.
Falling revenue surplus
Revenue surplus was 1.23% as a percentage of GDP in 2014-15. The next year, it shot up to 1.56%. Ever since, it has been on a downward trajectory and is likely to reach negative territory for the first time.
While Delhi was 0.85% revenue surplus in 2016-17, the figure was 0.72% in 2017-18, 0.85% in 2018-19 and 0.95% in 2019-20, respectively. In 2020-21, it was 0.19% of the GDP – the lowest under the AAP. It bounced back partially the next year to 0.37%. At the same time, the revenue expenditure of the government doubled in eight years – from around Rs 23,500 crore in 2014-15 to over Rs 46,000 crore in 2021-22.
Falling tax revenues as a percentage of GDP
AAP’s ability to mobilise revenue has taken a hit over the last 10 years, as is evident by its falling tax revenues as a percentage of its GDP. In 2014-15, tax revenue made up 5.38% of Delhi’s GDP. The figure hovered from 5.05% to 5.49% till 2017-18. In 2018-19, it dropped to below 5% (4.96%) for the first time. Its downward trajectory continued in the following years.
In 2020-21, it dropped to 3.95% recovering the next year to 4.54% – still a percentage point lower than 2014-15 and around 2 percentage points lower than the Indian average of 6.27%.
Slightly over Rs 26,600 crore of own tax revenue was mobilised in 2014-15. This number grew gradually to Rs 40,018 crore by 2021-22 – a rise of Rs 1,916 crore on average annually, compared to an annual increase of Rs 5,000 crore in the Budget size.
You May Like


Photos