Journalism of Courage
Premium
This is an archive article published on November 3, 2022
In Delhi, vehicles are worst offenders when it comes to pollution
Vehicles caused half or around 51% of the national capital’s own contribution to PM2.5 levels from October 21 to 26, the analysis said. When contribution from other NCR districts and biomass burning to air pollution in Delhi is considered, vehicles contributed around 17% of the PM2.5 concentration.

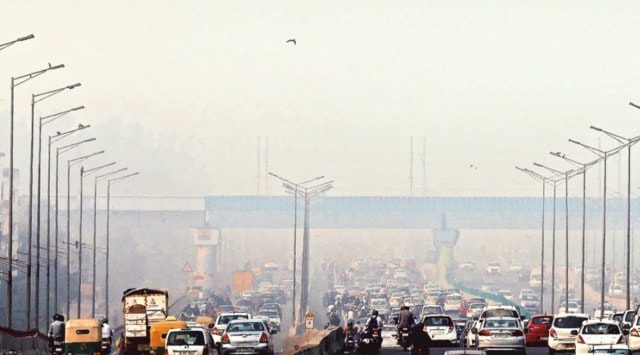 Vehicles caused around 51% of Delhi’s contribution to PM2.5 levels from October 21 to 26, the analysis said. Praveen Khanna
Among local sources, vehicles may have contributed the most to air pollution in Delhi over the week from October 21 to 26, according to an analysis by the Centre for Science and Environment (CSE).
Vehicles caused half or around 51% of the national capital’s own contribution to PM2.5 levels from October 21 to 26, the analysis said. When contribution from other NCR districts and biomass burning to air pollution in Delhi is considered, vehicles contributed around 17% of the PM2.5 concentration.
The daily share of vehicular emissions ranged from around 49.3% to 53% over the week. This was followed by residential sources at 13%, industrial sources at 11% and construction at 7%.
The CSE has drawn data from the Indian Institute of Tropical Meteorology’s Decision Support System (DSS) which provides information on the contribution of emissions from Delhi and surrounding 19 districts to air quality in Delhi. The DSS modeling uses an existing emissions inventory prepared by The Energy and Resources Institute. This inventory is being updated this year.
The overall share of “combustion sources” was also found to be higher than that contribution of construction and road dust. The analysis states: “The overall share of all combustion sources that include vehicles, peripheral industries, energy sector, waste burning and residential cooking among others, have contributed higher than the dust sources that include construction and road dust.” The contribution of Delhi’s own sources to pollution levels in the city was estimated to be around 32.9%, while the contribution from the NCR districts is likely to have been around 32.8% and biomass burning contributed around 9.5%.
The CSE analysis also used data from Google Maps to determine the traffic speed along 15 arterial roads in the city over the week. “High congestion was found on all roads”, with the maximum congestion on GT Karnal Road and Guru Ravidas Marg, the analysis notes, explaining that the average speed was found to be 27 to 32 kmph on the roads analysed.
It further adds: “The working day before Diwali (October 21) and October 22 saw heavy congestion and average speed was observed at 23.7 and 23.8 kmph respectively. On Diwali day (October 24) and post Diwali day, when overall traffic reduces normally, average speed on road was higher at 33 and 32 kmph respectively. Diwali day had the least traffic build-up.”
Story continues below this ad
With vehicular emissions contributing to nitrogen dioxide levels, increased concentration of this gaseous pollutant was also found to coincide with the time that congestion is recorded on the roads, according to the analysis which used the Central Pollution Control Board’s hourly data. NO2 levels peaked at 7 pm on October 22 and 26. The analysis makes a case for a “verifiable and measurable shift to public transport”. It states: “Even though vehicles are the top polluters in Delhi, action to control their explosive numbers and usage have remained the slowest. Even the air emergency measures enforced for the very poor and severe categories of AQI under the GRAP do not include action, barring increased parking charges… the city also needs extensive networks of walking and cycling infrastructure to connect different neighbourhoods for functional usage at the local level.”
“This is the week when AQI turned ‘very poor’ and the analysis is on what contributed to Delhi’s air. The DSS doesn’t look at firecracker emissions, which is a Diwali-day thing,” said Anumita Roychowdhury, executive director, research and advocacy, CSE.
Advertisement
Top Stories


Live Blog
Loading Taboola...
Advertisement