Journalism of Courage


In this composite map of the activity of genes, enzymes and other processes operating in people8217;s brains8212;developed by Arthur Toga, a neuroscientist and computational biologist at the University of California at Los Angeles8212;the blue ovals represent functions that operate almost identically in everyone. The frontal cortex, where higher thinking occurs, is a blur of warmer colours, an indication that these functions differ considerably among individuals.
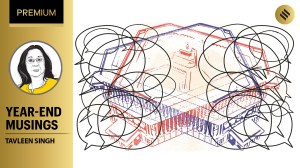
A Map of Social Interactions centre: It may look like the Native American dream catcher hanging from your rearview mirror, but all those lines are computer representations of social interactions among individuals, with each red dot along the inner and outer circles representing a person. Stephen Eubank, a physicist at Virginia Bioinformatics Institute at Virginia Tech, is using dynamic models such as this one to predict how contagious diseases will spread.
A Bejeweled Bacteriophage:
When University of Idaho evolutionary biologist Holly Wichman isn8217;t studying how viruses capitalise on DNA mutations to adapt to new conditions, she is making models of her favorite viruses with tiny plastic beads and nylon thread. Asked how many beads it took to make this model of this bacteriophage, she gave the very scientific answer of 8217;8217;10 godzillion.8217;8217;