


© The Indian Express Pvt Ltd
Tags:

ExplainSpeaking-Economy is a weekly newsletter by Udit Misra, delivered in your inbox every Monday morning. Click here to subscribe
Dear Readers,
This week the Indian state of Karnataka goes to polls. The voting will happen on May 10th and the results will be counted on May 13th. This is a crucial election not only because Karnataka is one of India’s biggest and most influential states but also because it could set the tone for a series of crucial elections in the coming months leading all the way to the national general elections in early 2024.
Here’s a quick look at some of the key economic and social metrics of Karnataka. The idea is not just to look at how Karnataka compares with the India average and some of the other big states but also analyse how it has shaped up over the past four-five years. To be sure, the last state elections in Karnataka happened in May 2018 and as such data for the financial year ending March 2018 provides a good backdrop for comparisons.
The GSDP is the market value of all goods and services produced within a state. It is akin to the GDP measure for India as a whole. The higher the GSDP, the bigger the size of a state’s economy.
Table 1 alongside provides the GSDP data for several states for two financial years — 2021-22 and 2017-18. The source is RBI’s Handbook on Statistics on Indian States that was released in November last year. The choice of the states has been made based on the availability of data. For instance, Gujarat and Maharashtra, two of the biggest state economies, miss out because the relevant data was not available.

There are three ways to read the data provided in Table 1.
One is to look at the first column and figure out how Karnataka compares in size with some of the other big states.
Two is to look at where Karnataka (or for that matter any of the other states mentioned) was five years ago.
Three is to look at the degree to which Karnataka’s GSDP has grown over these years.
Of the economies mentioned, Karnataka seems to have grown better than most. It is important to note that the period in question includes the Covid-shock. By the end of FY22, Karnataka had almost caught up with Tamil Nadu and, at this rate, would perhaps overtake its southern neighbour by the time data for FY23 (financial year ending March 2023) is available for all states.
Andhra Pradesh and Telangana too have witnessed a similar increase in the size of their economies while states like UP and Kerala have lagged behind.
The data in Table 1 provides nominal figures; that is to say the data includes the effect of inflation. But what happened to the size of the economy if one was to take away the effect of inflation?
Table 2 provides the answer to that. The GSDP shrinks down for all states when we remove the effect of inflation. And even though Karnataka still comes out as one of the best performers (within this group) in terms of percentage growth, it remains almost as far behind Tamil Nadu in absolute terms as it was four years ago.
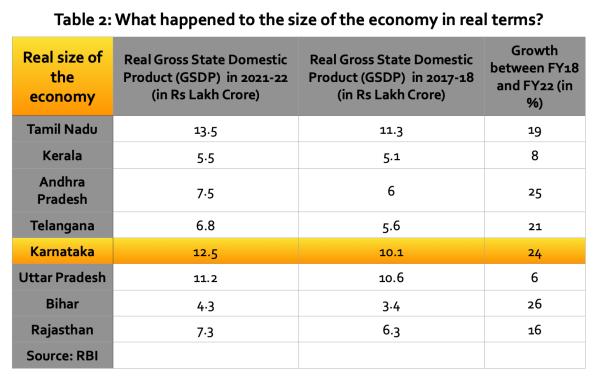
A somewhat surprising but noteworthy point is the growth of Bihar’s economy — the highest among all the states considered here.
While the overall size of the economy is one big measure, what often determines prosperity is the average economic output or income in a state. Table 3 provides details of what happened to “real” per capita incomes in Karnataka and elsewhere between FY18 and FY22.
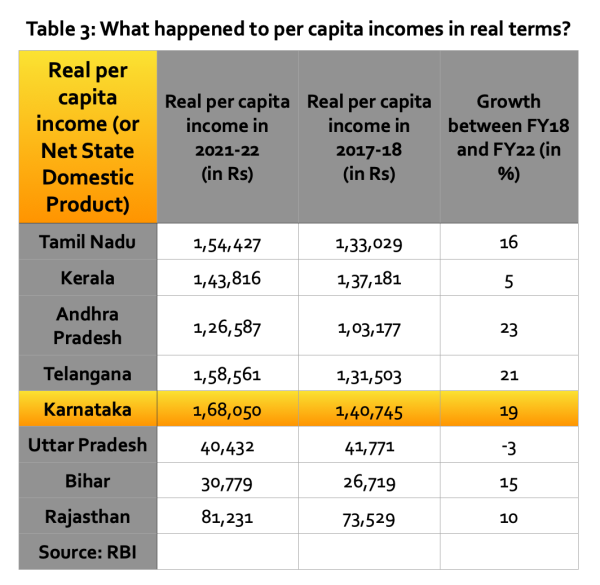
Despite lagging behind Tamil Nadu in overall size, Karnataka stays ahead on per capita terms. Again, the growth in per capita incomes in Karnataka is only behind Andhra and Telangana.
It is noteworthy that Uttar Pradesh is the only state in this table which has seen per capita incomes contract over these four years. That the ruling party and chief minister were elected back with a resounding majority puts that data as well as any such analysis in perspective.
Inflation rate has been one of the biggest concerns in recent years. Table 4 provides a snapshot of how Karnataka fared in each of the past few years.
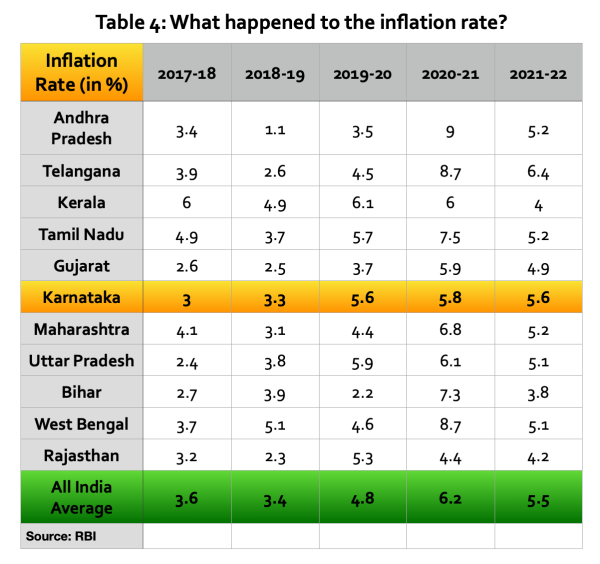
In most years, Karnataka performs better than other southern states as well as the India average. Only Rajasthan, Gujarat and Bihar seem to have done better than Karnataka. Bihar’s lower inflation rate explains why its performance stood out when considering the size of the economy in real terms in Table 2.
CHART 1 maps the unemployment rate for India and Karnataka. The data is sourced from CMIE.
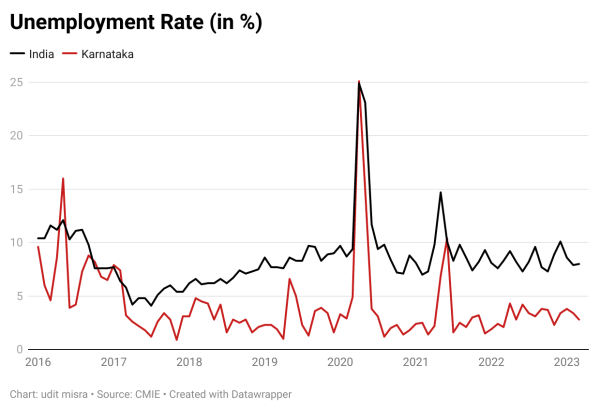
Barring the two Covid waves, Karnataka’s unemployment rate remained much lower than the national average. On the face of it, this result will align well with other measures such as growth in GSDP.
However, the unemployment rate is a poor metric for gauging labour distress in a country like India. That’s because the unemployment rate only tells the number of people who did not get a job while they were looking for it. Under normal circumstances this measure is good enough. But in India, the number of people seeking a job itself keeps falling. As such, unemployment rate often under-reports the labour stress because it fails to capture the number of people who got discouraged and stopped looking for work.
That is why it is better to look at the next variable to accurately understand what is happening to jobs in the state.
Simply put, the Employment Rate states the number of employed people in the state as a percentage of the total working-age population (that is, the population above 15 years of age).
Table 5 puts together the latest publicly available data from CMIE.
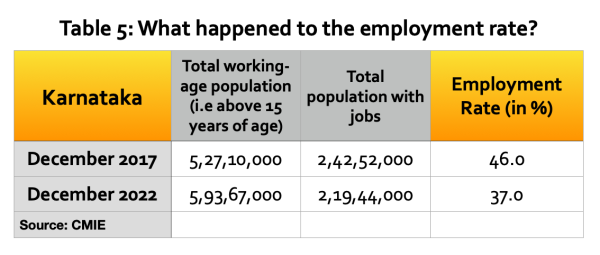
As of December 2017, out of a total working-age population of 527 lakhs, Karnataka had around 242.5 lakh people with jobs. That’s an employment rate of 46%. This was not a high enough number to begin with. However, by December 2022, while the working-age population swelled by another 67 lakhs, the total number of people with jobs, instead of rising, actually fell by more than 23 lakhs.
The significantly lower employment rate shows that even as the size of the state’s economy is expanding, far from creating new jobs, this growth is happening with fewer jobs. This also implies that higher per capita incomes are only of academic importance since they essentially hide the economic stress in the state.
Table 6 provides that data for Karnataka and the all-India average from the last two rounds of the National Family Health Survey (NFHS).
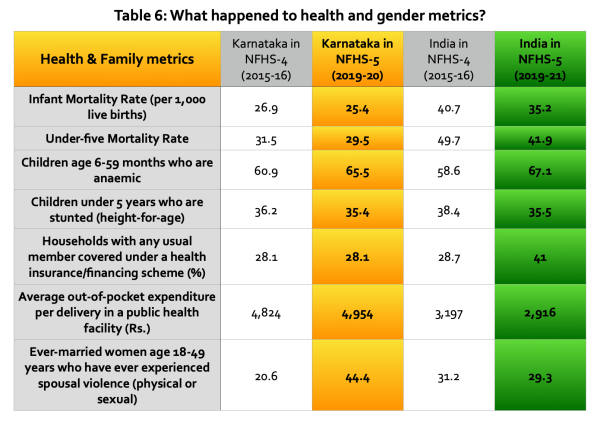
On the face of it, on most metrics of NFHS (and there are 131 of them), Karnataka does much better than the all-India average.
The Infant Mortality Rate and Under-five Mortality Rate in Table 6 bring this out clearly.
However, there are some metrics where despite being one of the richer states, Karnataka exhibits the same stagnancy that is visible in all-India data. Proportion of stunted children is a case in point.
Then there are some variables on which Karnataka lags the India average. For instance, the average out-of-pocket expenditure per delivery in a public health facility is not only higher than the India average but also rising — a stark contrast to the all-India trend.
Do economic and social indices matter when it comes to voting? Share your views at udit.misra@expressindia.com
Until next week,
Udit

