Stay updated with the latest - Click here to follow us on Instagram
Journalism of Courage

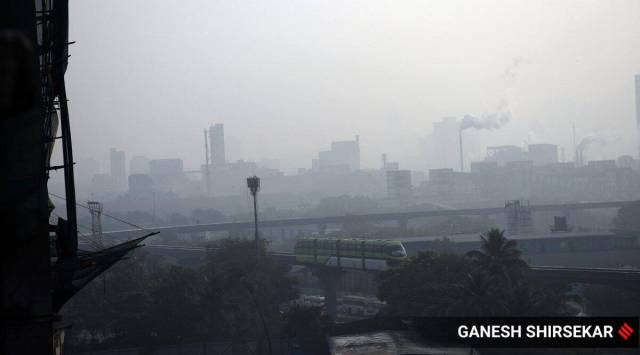 The major air pollutants for Mumbai during the period are particulate matter of 2.5 and 10 microns (PM2.5 and PM10). (Express file)
 As the trend of bad air quality continues in Mumbai, February days have recorded the worst air quality in the past four years, revealed an Indian Express analysis of daily air quality index (AQI) data from the Central Pollution Control Board. This is despite the passage of cold temperatures, which are conducive to worsening air quality, according to experts.
In the past 16 days of February, Mumbai recorded eight days with a “poor” AQI, compared with only two such days each during the same period last year and 2021 and none at all in 2020.
While the past 16 days recorded no “good” or “satisfactory” days, there were two “satisfactory” days in 2021 and one “satisfactory” day in 2022 during the same period. The number of “moderate” days has also reduced this February to eight—a drop from 13 in 2022 and 12 in 2021 during the same period.
The major air pollutants for Mumbai during the period are particulate matter of 2.5 and 10 microns (PM2.5 and PM10).
According to the board, an AQI is “good” between 0 and 50, “satisfactory” between 50 and 100, “moderate” between 100 and 200, “poor” between 201 and 300, “very poor” between 301 and 400 and “severe” between 401 and 500.
Authorities have attributed the worsening air quality in the Maharashtra capital to two main factors: real estate and infrastructure construction work and transport. Apart from vehicular combustion, heavy traffic is also responsible for stirring up settled road dust.
After presenting the Brihanmumbai Municipal Corporation’s budget for 2023-24, commissioner Iqbal Singh Chahal told reporters that the city had more than 3,500 construction projects at present.
Abhishek Chakraborty from the Indian Institute of Technology Bombay said that a lot of accumulation of pollution takes place in winter, as it does not get dispersed as easily, because solar radiation is law.
“While core winter has passed, we are still not seeing summer temperatures. The atmospheric factor linked to bad AQI is likely to pass within the next month or so, and the situation may improve slightly. However, taking an average of readings on all monitors to determine AQI may not present an accurate picture, as some of the monitors are located in residential areas, while some others in non-residential areas, where pollution levels are not uniform,” he said.
| AQI categories for 16 days of February in 2020-23 | ||||
| Days | 2023 | 2022 | 2021 | 2020 |
| Poor | 8 | 2 | 2 | 0 |
| Moderate | 8 | 13 | 12 | 16 |
| Satisfactory | 0 | 1 | 2 | 0 |
*Figures are number of days
Stay updated with the latest - Click here to follow us on Instagram