


© The Indian Express Pvt Ltd
Tags:
FEWER younger MPs than in the early years of Parliament, more women voters but only a partial increase in women representation in the House, fewer sittings and fewer Bills, but an increase in the number of ordinances passed. With the five-day special session of Parliament beginning September 18 set to discuss “Parliamentary Journey of 75 years starting from Samvidhan Sabha – Achievements, Experiences, Memories and Learnings”, here is a look at how that looks like:
Notwithstanding the rising share of youth in the total population of the country, the number of parliamentarians aged 35 and below in the Lok Sabha has dwindled to a record low.
Documents available on the Lok Sabha portal show that while this number stood at 82 in the First Lok Sabha (still the highest ever), it is 21 in the ongoing 17th Lok Sabha. Their number has fallen by a fourth despite the total number of seats in the Lower House increasing from 499 to 545 during this period, and despite the rising youth population in the country.
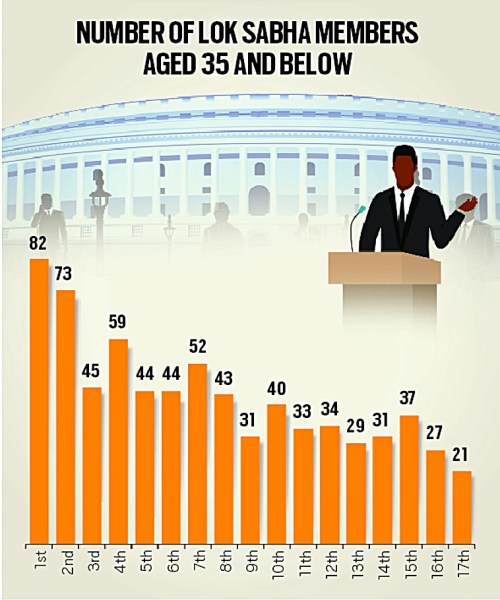
As per Census 2011, about 66% of India’s population was below 35 years of age. Given the dwindling number of young MPs, the average age in the Lok Sabha has risen over the years — from 46.5 years in the First Lok Sabha (1952-57) to 55 years in the 17th (2019-2023).
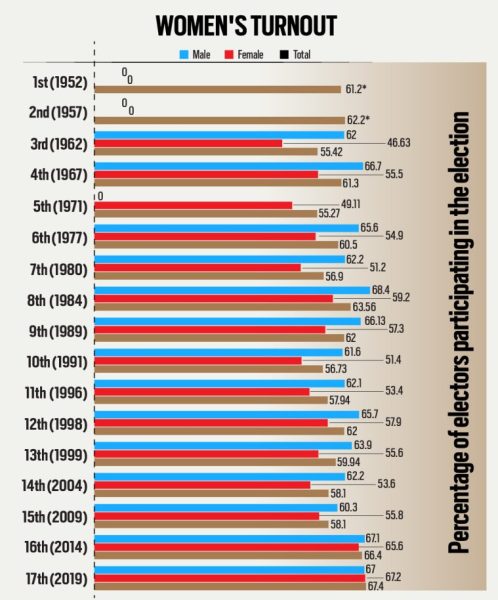
Women’s turnout has been steadily increasing since 1962, the earliest year for which data is available. That year, 62% of the male voters and 46.6% of the women electors turned out to vote; by the time of the 2019 polls, women had left men behind, at 67.2% voting compared to 67%.
Correspondingly, the number of women candidates has also risen, from just 45 in the 1957 Lok Sabha elections (the second) to 726 in 2019. However, their share in the Lok Sabha ranks remains low. In the first Lok Sabha (1951), there were 22 women MPs, 4.41% of the total 489. In 1957, 27 women got elected out of 494 total. The figure of 78 elected in the 2019 Lok Sabha elections is the highest ever, but it is still only 14.36% of the total. That makes it less than half of the 33% seats envisioned to be kept aside for women by the women’s reservation Bill. The last initiative to pass it was by the UPA government in 2008, when it introduced it in the Rajya Sabha to ensure it didn’t lapse with change in government. However, the Bill failed to clear the Lok Sabha in 2010.
In the history of Independent India, the 17th Lok Sabha is on course to becoming the first to not have a Deputy Speaker.
As per The Rules of Procedure and Conduct of Business in Lok Sabha, the election of the Deputy Speaker “shall be held on such date as the Speaker may fix”, once a motion proposing his name is carried. In Article 179 for state legislatures, the Speaker or Deputy Speaker “shall vacate his office if he ceases to be a Member of the House of the People”.
Usually, the Deputy Speaker is elected soon after the election of the Speaker.
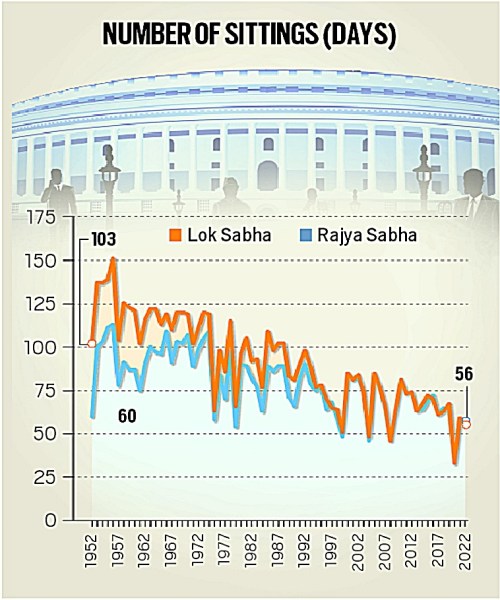
Between 1952 and 1974, the Lok Sabha met for over 100 days a year each. Since then, the Lower House has not crossed the100-day annual threshold except in 1978, 1981, 1985, 1987 and 1988. The maximum number of days the Lok Sabha met in a year was in 1956, when it held 151 sittings; while its lowest was in Covid year 2020, when it met for 33 days.
The Rajya Sabha also saw its lowest number of sittings (33days) in 2020, and the highest (113 days) in 1956. For the Lok Sabha, the average number of minutes per day of sitting have also come down from 335 during the first Lok Sabha (1952-1957) to 314 in 14th Lok Sabha (2004-2009). Comparable data for 2019-2023 is not available.
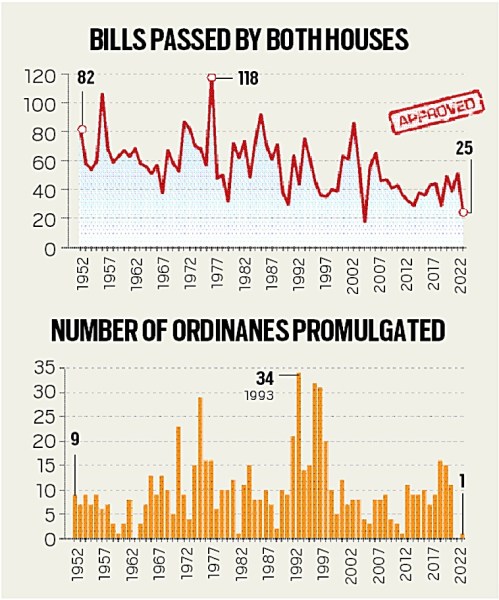
Not only are both Houses seeing fewer sittings, they are also passing fewer Bills. The highest number of Bills were cleared by the Lok Sabha and Rajya Sabha in 1976 (during the Emergency), when 118 Bills were passed. The lowest was in2004 (when the UPA-I government came to power), when the number stood at only 18. The second-lowest figure was in 2022, when 25 Bills were passed.
With the Houses sitting for fewer days and passing fewer Bills, there has been an uptick in the ordinances promulgated by the Union government. From 1952 to 1965 (a period of stable Congress governments in power), the number was in single digits. From 1966 to the early 1980s (when the period of political uncertainty at the Centre began), it rose to double digits per year. This number again saw an increase during the 1990s (when there were coalition governments), but fell between 2002-2012 (starting from the Vajpayee era and lasting into the UPA I and II governments).
Since 2013 (one year before the Modi government came to power), there has again been an uptick in the number of ordinances issued by the Centre.
Under active campaigns by the Election Commission to enrol voters, the electorate numbers have increased six-fold — from 173.2million in 1951 to 912 million in 2019. The Election Commission usually sets up a polling station per 1,200 electors in rural areas and 1,400 electors in urban areas. With the increase in the number of electors, polling station numbers have increased from 1.96 lakh in 1951 to 10.37 lakh in 2019.

The number of parties contesting Lok Sabha polls is 12 times what it stood in the first elections. Only 53 parties across India took part in the 1951 polls, while 673 did so in 2019. Like the number of parties, the number of contestants is also on the rise — from 1,874 in 1951 to 8,054 in 2019.

Of the 17 Lok Sabha elections held in the country so far, 10 have yielded a clear majority, while 7 have resulted in fractured mandates (1989, 1991, 1996, 1998, 1999, 2004 & 2009). During the periods of fractured mandate, there were occasions when the party with the highest number of seats received a lower percentage of votes than the runner-up. For instance, the BJP won the highest number of seats (161) in 1996, but its vote share (20.29%) was lower than that of the Congress (28.8%) — which came runner-up with 140 seats. A similar trend was seen in 1999 and 2004. But since 2004 (when the UPA I government first came to power), this trend has reversed, with the winning party receiving a higher vote share than the runner-up.
As per 60 Years of Lok Sabha, published by the Lok Sabha Secretariat, the time spent by the House on questions has seen a decline. While the First Lok Sabha (1952-57) spent 15% — 551 hours and 51 minutes of its total time of 3,783 hours and 54minutes — on questions and answers, the figure fell to 11.42% during the 14th Lok Sabha (2004-2009). Comparable data is not available for the 15th, 16th and 17th Lok Sabhas.

