


© The Indian Express Pvt Ltd
Tags:

Dear Readers,
As scheduled, on Thursday, Finance Minister Nirmala Sitharaman will present the Union Budget for the forthcoming financial year (2024-25). However, since this is the interim Budget — a full-fledged one will be presented after the general elections by the new government in July — the Budget speech is likely to be an exercise in underscoring the achievements of the incumbent government not just over the past year but also over the past decade. Just as predictable is the likely response of the Opposition parties; they are likely to argue that Budgets by the BJP-led government have failed the country, especially its most vulnerable sections.


Each year’s Budget provides two pie charts. One pie chart tells the source-wise break-up of each rupee that the government earns. The second pie chart details where each rupee is spent. These charts do not tell the absolute amount of the money spent — instead, they tell the proportionate share.
Looking at these two charts is hugely rewarding for two reasons.
One, they tell about the current state of the government’s financial health clearly and concisely. Two, looking at such pie charts for two different years can tell how the financial health has changed.
For instance, CHART 1 shows the different sources of income in the current financial year (2023-24). More specifically, 34 paise in each rupee — or 34% of the total income — came from the borrowings of the government.
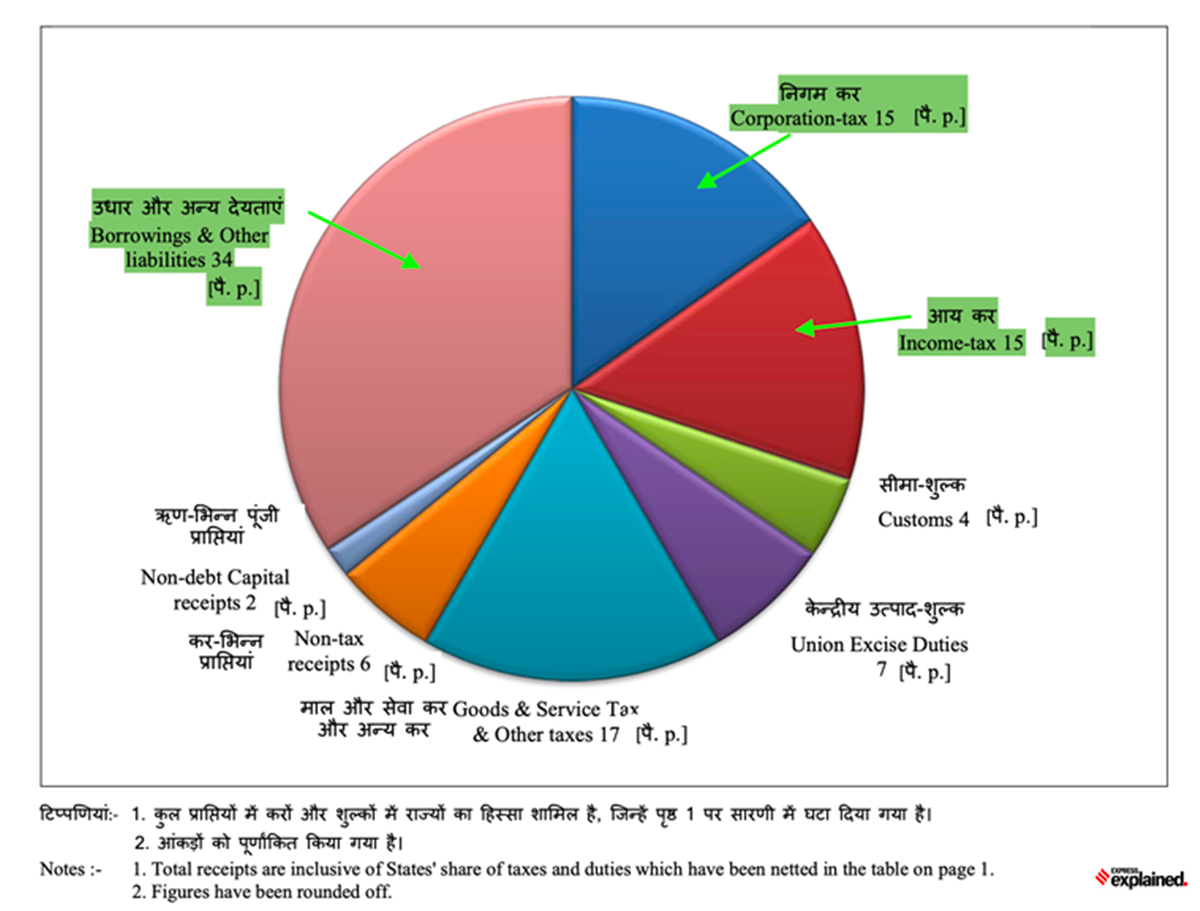
As many as 15 paise per rupee came from direct income tax imposed by the government and another 15 paise came from the corporation tax (or the tax that the government imposes on companies), and so on and so forth.
To further understand how this break-up has changed over the years one can compare it with a similar break-up from any past year. For instance, CHART 2 shows the same break up for 2016-17 (bigger pie chart) and 2015-16 (smaller pie chart).
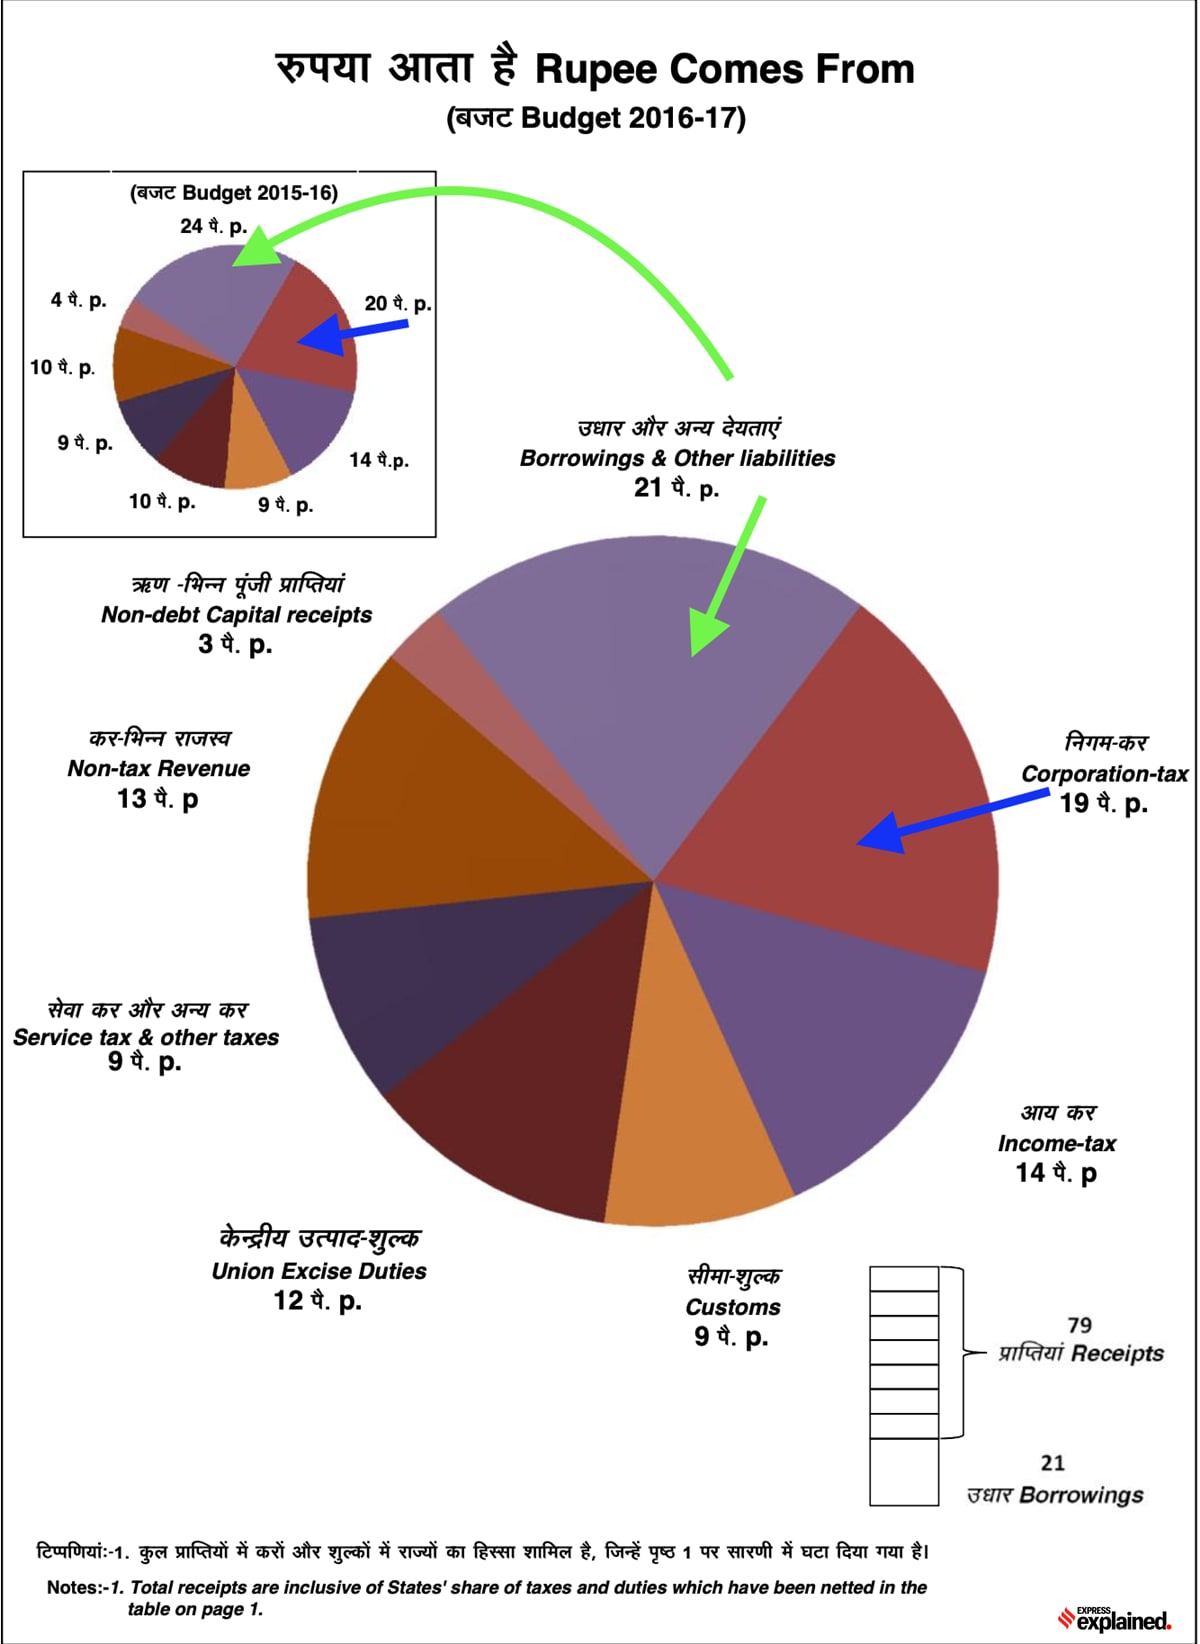
In 2016-17, for instance, borrowings accounted for just 21 per cent of the government’s total income. In other words, the government’s dependence on borrowings has increased over the past few years. In 2015-16, borrowings accounted for 24 per cent of total income.
Similarly, taxes from companies accounted for 19% of all income in 2016-17 (and even higher 20% in 2015-16) while they were just 15% in 2023-24.
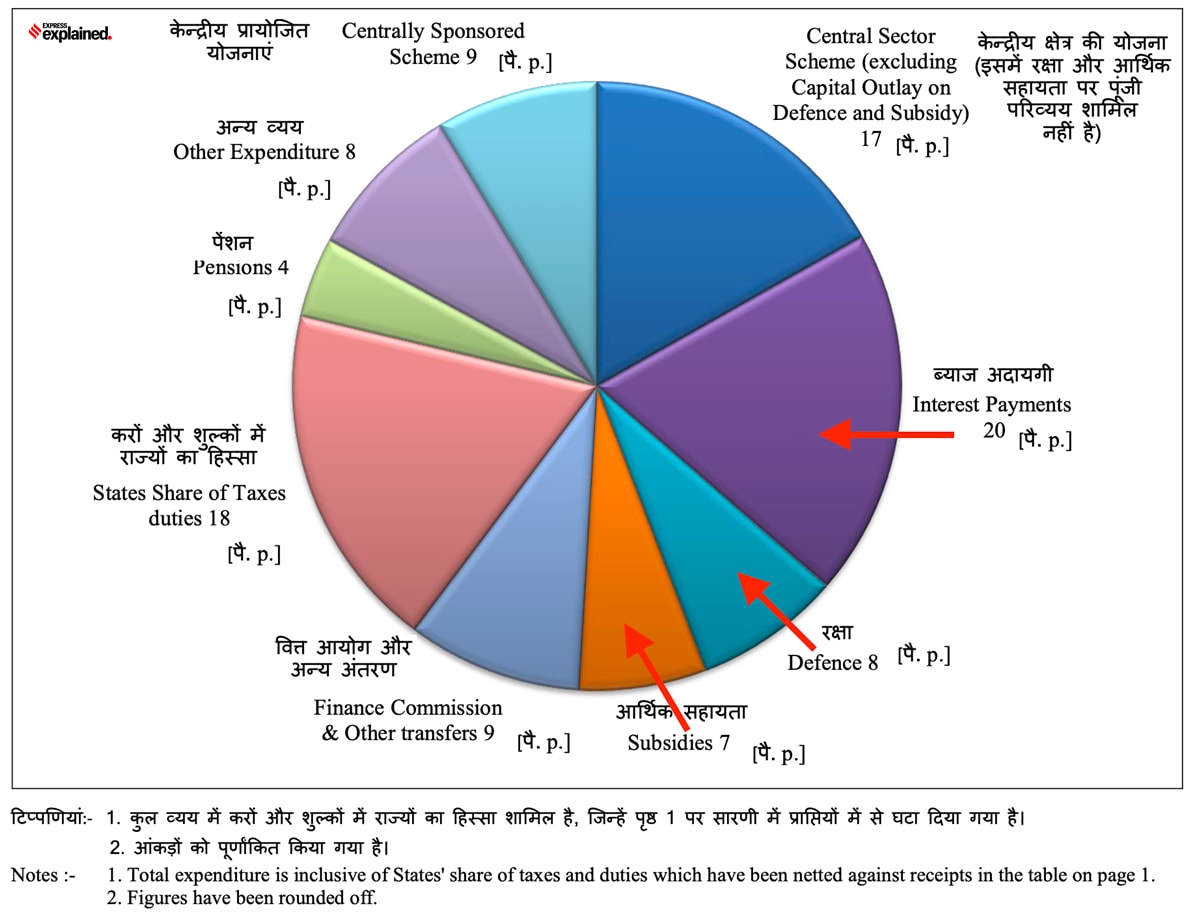
Similar comparisons can be made when one compares pie charts for “where the rupee goes” that detail the government’s spending priorities. Sample CHART 3, where the rupee goes in FY17, and CHART 4 (for FY24) below.
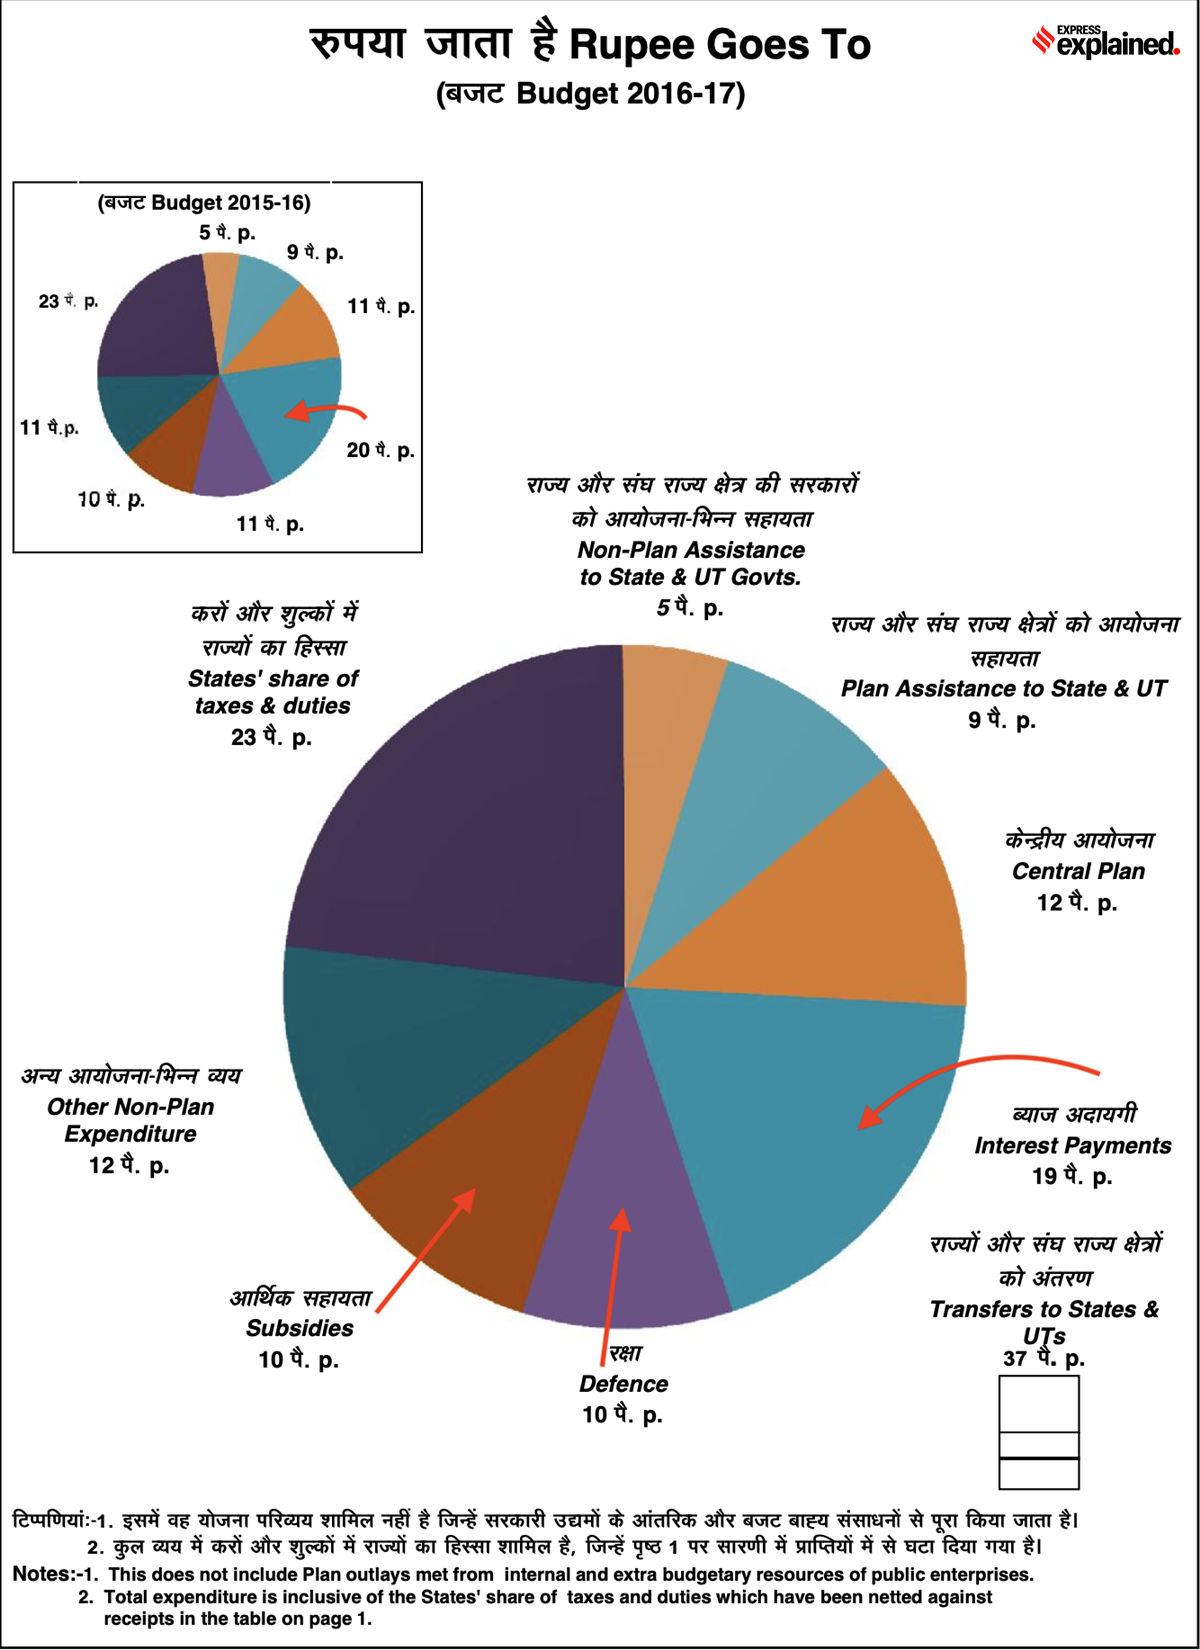
In FY17, defence received 10 paise from each rupee spent while in FY24, this proportion had fallen to 8 paise. Similarly, in FY17 10 paise from each rupee went for subsidies of different kinds while in FY24, this proportion fell to 7 paise per rupee (or 7%).
The presentation of the Union Budget is a time when a lot of numbers and percentages are thrown around. It is of critical importance for readers to be aware of whether any number — be it the absolute amount or growth rate or increase or decrease in allocation — is nominal or real.
The difference between nominal and real changes is inflation. Your salary is stated in nominal terms. So is your annual increment. But the purchasing power of a Rs 30,000 (per month) salary today is very different from that of the same salary a decade ago. That’s because, in the past 10 years, inflation would have raised the general price level, thus resulting in the same amount of money buying fewer and fewer goods each passing year.
Similarly, a 7% increase in the Budget allocation of a department may not mean much in “real” terms if inflation, too, has increased by 7%. Indeed, a nominal increase in budget allocation could even result in a decline in budget allocations in “real” terms.
This distinction must be remembered also from the point of view of GDP growth.
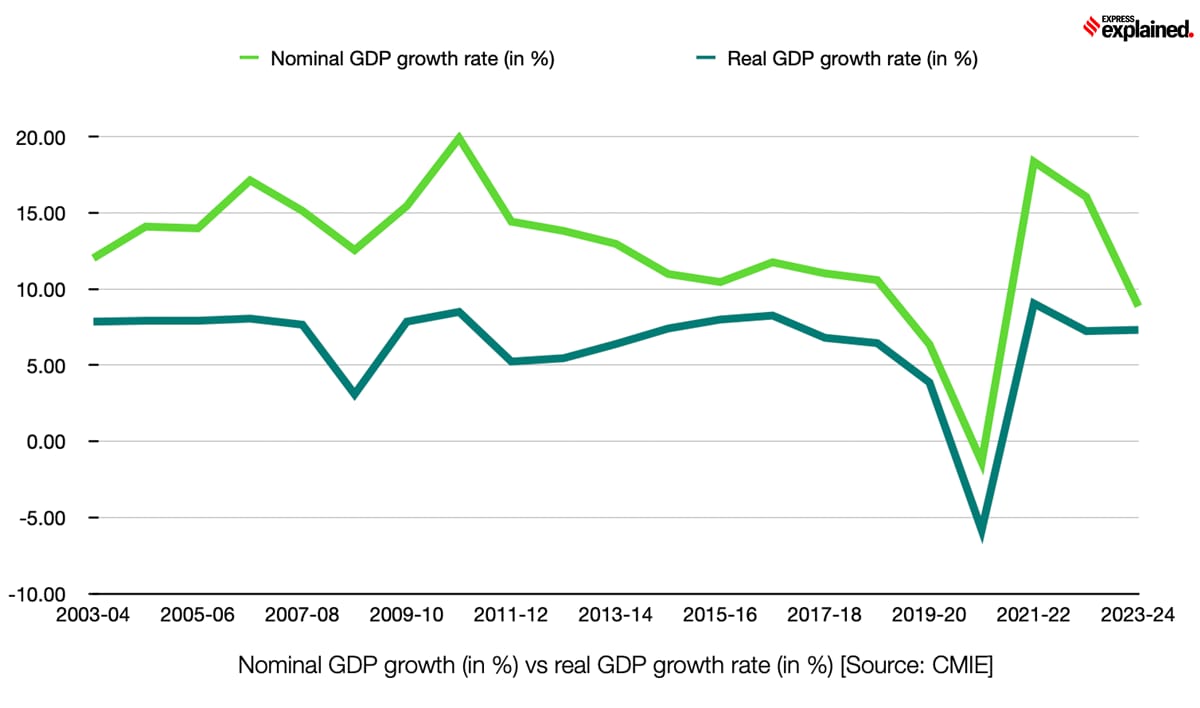
The nominal GDP growth rate — the rate at which GDP grows, inclusive of inflation — is possibly the most important data mentioned in the Budget since it forms the base for all other calculations. For instance, the fiscal deficit (read borrowings) targets are set as a percentage of (nominal) GDP. So if the nominal GDP is small, the amount of money that the government can borrow is also smaller.
Like all nominal data, the nominal GDP is the actual data that is observed in the economy; the real GDP and the real GDP growth rates etc. are essentially derived from nominal data after removing the effect of inflation.
CHART 5 shows how the two variables have grown over the past two decades.
As the Indian economy has become a big enough player in the global economy, analysts across the world wanted to know whether its government can remain solvent. In other words, whether India’s government is good enough to pay its bills.
That is why analysts keep their eyes peeled for the fiscal deficit number.
The fiscal deficit is essentially the amount of borrowing that the government is forced to have when it can’t meet all its expenses with its income. Each year’s fiscal deficit adds to the mountain of government debt.
A high fiscal deficit is seen as a warning sign.
Over the years, India has set prudential limits for its fiscal deficit. The Fiscal Responsibility and Budget Management (FRBM) Act of 2003 stated that the fiscal deficit of the union government should not exceed 3% of GDP. It also set another key marker: The revenue deficit — the gap between the government’s everyday expenses (say salaries and pensions) and everyday earnings (taxes, cesses etc) — should be zero.
The dual stipulation — fiscal deficit at 3% and revenue deficit at 0% — is essentially meant to ensure that all the money that the government borrows is spent towards the creation of new productive assets.
However, over time the compliance of this dual mandate weakened. In 2018, the law was amended and targeting revenue deficit was dropped.
This meant that India could have a scenario where even though the fiscal deficit was 3% of GDP, all of the borrowing could be going to fund the revenue deficit. In other words, genuine fiscal prudence was dented.
CHART 6, sourced from last February’s Budget presentation, shows something similar happening. It showed that a large part of India’s fiscal deficit is actually in the form of a revenue deficit.

As such, the fiscal deficit number should not be read in isolation; instead, it should be read along with the revenue deficit. Only together can they provide a genuine picture of fiscal prudence.
Lastly, a lay reader may be confused by the repeated and seemingly interchangeable use of the phrases: Budget Estimates (BE) and Revised Estimates (RE). Moreover, should BEs always be compared to BEs or can be compared to REs?
To be sure, the two types of estimates denote very different things.
The Budget Estimates — say for the money to be spent by the Sports Ministry or the money to be collected via GST— for any year essentially show what the Finance Minister expects the value to be at the end of the financial year when she is presenting the Budget even before the start of the financial year. Each budget, thus, carries its own Budget Estimates.
However, as the year goes by, data — be it for income or expenditure — starts to trickle in. As such, by the time the budget is presented for the forthcoming financial year, the government also have the REs for the current financial year.
What about comparisons?
Comparing REs with the BEs for the same financial year provides a good understanding of how far the government came through on its promise (or assertion) well before the start of the financial year.

Another kind of comparison can be aimed at understanding how much the government is planning to spend on a particular scheme in the coming year. One can, in such a case, either compare the BEs of the two years (say FY24 and FY25) or the BE of the coming year (e.g. FY25) with the RE of the previous year (FY24).
Typically, the government spokesperson will always use the comparison that is favourable to it while the opposition will paint the most anaemic picture.
But the most apt comparison depends on the context.
Suppose, the government allocates Rs 10,000 crore (the BE) for a skilling scheme targeted at some marginalised section of the economy — say the rural poor or the minorities — in a particular year’s Budget. But as the year goes by it fails in conducting the skilling scheme and ends up spending only Rs 1,000 crore (the RE). However, for the next financial year, it allocates Rs 2,000 crore (the new BE) for the same scheme.
The government can compare BE (of the second year) to RE (of the first) and correctly claim that the budget for skilling has been doubled while the Opposition can compare BE to BE and justifiably claim that the budget allocation has been reduced by 80%.
Now imagine another scenario where, because there was a nation-wide health emergency, the government was forced to spend Rs 15,000 crore (RE) instead of the Rs 10,000 crore (BE) allocated in that year’s Budget; the additional Rs 5,000 crore was on account of nationwide vaccination. However, now that the whole country is vaccinated, the BE for the next financial year has been set at Rs 12,000 crore.
In this case, the Opposition can compare BE for the second year with the RE of the first to claim that the government has cut the budget allocation on health. The government, on the other hand, can argue that (since vaccinations are not going to be required in the second year) it has raised the budget allocation by 20% (by comparing the two BEs).
For a real-life example, look at Table 1 sourced from last year’s Budget. The REs (Rs 530 crore) for the “Umbrella Programme for Development of Minorities” in 2022-23 were less than 30% of the original BEs (Rs 1,810 crore).

The BE for the current financial year (2023-24) was pegged at Rs 610 crore. That’s an increase of 15% relative to the RE but a decline of 67% compared to BE.
Which comparisons make more sense to you?
While you are looking at the data table above, also look at the BE for MG-NREGA for the current financial year. At Rs 60,000 crore, the allocation for FY24 was 18% lower than the BE of FY23 and 33% lower than the RE — both in nominal terms. In real terms, the allocations were even lower.
Share your views and queries at udit.misra@expressindia.com
Until next time,
Udit


