


© The Indian Express Pvt Ltd
Tags:
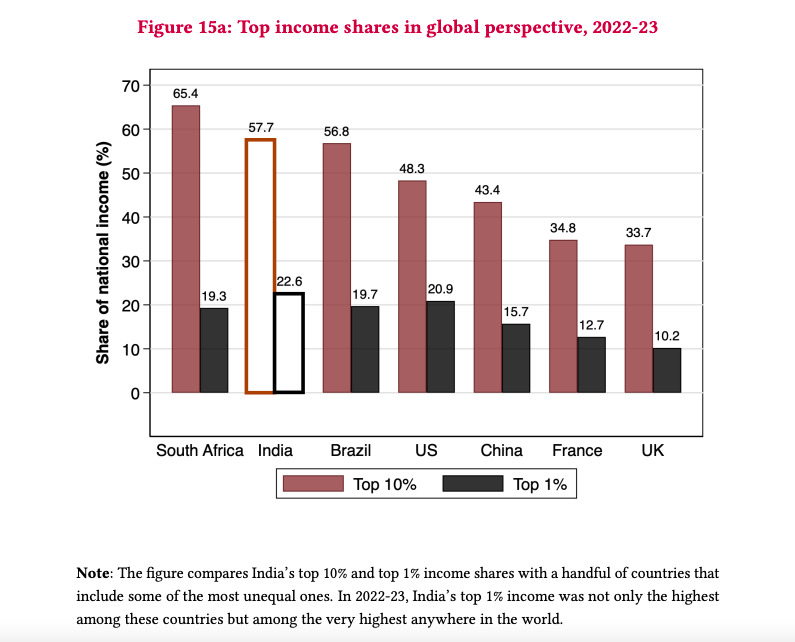
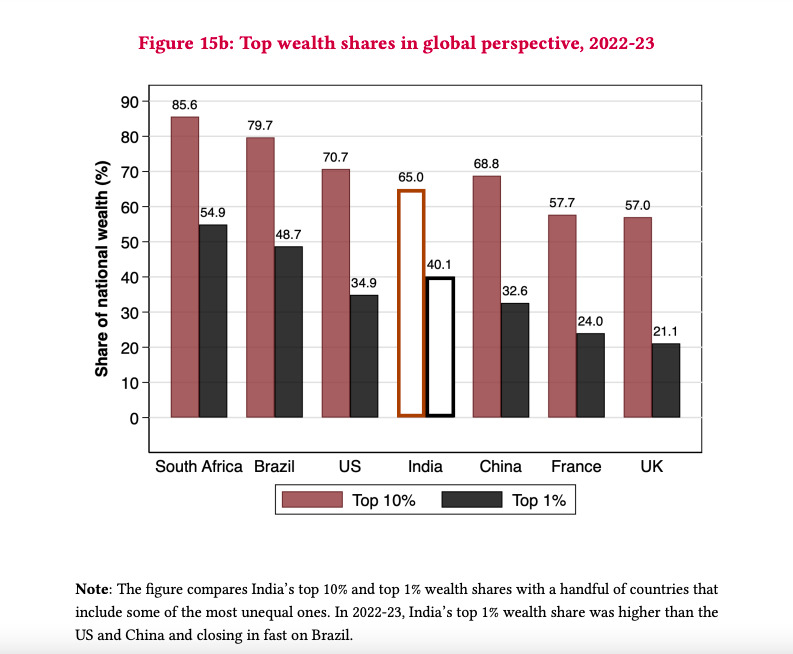
India’s top 1 per cent income and wealth shares have reached historical highs and are among the very highest in the world, according to a paper released by World Inequality Lab. By 2022-23, the top 1 per cent income share in India was 22.6 per cent and the top 1 per cent wealth share rose to 40.1 per cent, with India’s top 1 per cent income share among the very highest in the world, higher than even South Africa, Brazil and the US.
Co-authored by economists Nitin Kumar Bharti, Lucas Chancel, Thomas Piketty, and Anmol Somanchi, the paper stated that the “Billionaire Raj” headed by “India’s modern bourgeoisie” is now more unequal than the British Raj headed by the colonialist forces.
The paper said there is evidence to suggest the Indian tax system might be “regressive when viewed from the lens of net wealth”. A restructuring of the tax code is needed, the paper said, adding that a levy of a “super tax” of 2 per cent on the net wealth of 167 wealthiest families would yield 0.5 per cent of national income in revenues and create space for investments.
“A restructuring of the tax code to account for both income and wealth, and broad-based public investments in health, education and nutrition are needed to enable the average Indian, and not just the elites, to meaningfully benefit from the ongoing wave of globalisation. Besides serving as a tool to fight inequality, a “super tax” of 2% on the net wealth of the 167 wealthiest families in 2022-23 would yield 0.5% of national income in revenues and create valuable fiscal space to facilitate such investments,” the paper said. The paper has analysed data based on the annual tax tabulations published by the Indian income tax authorities to extract the distribution of top income earners between 1922-2020.
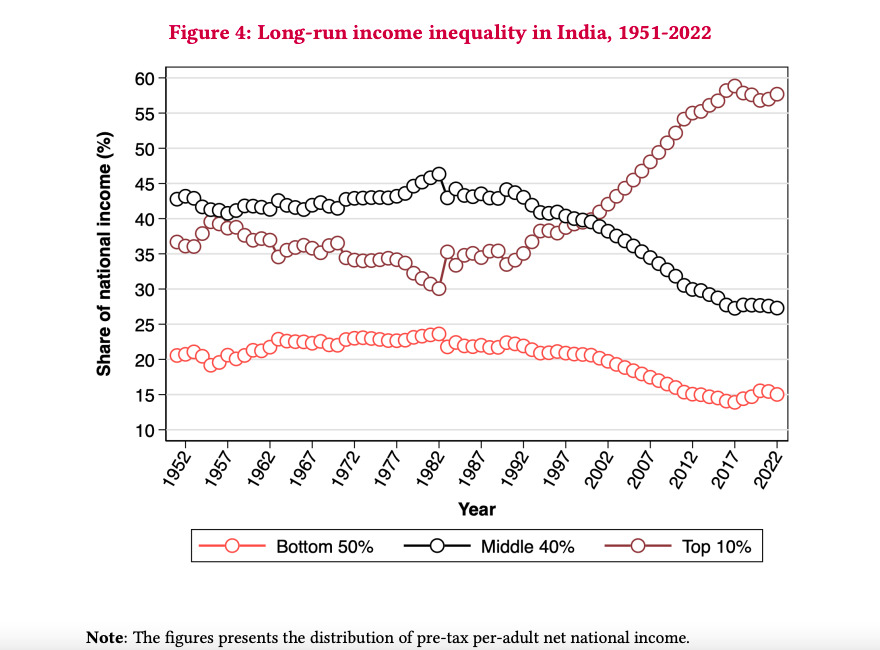
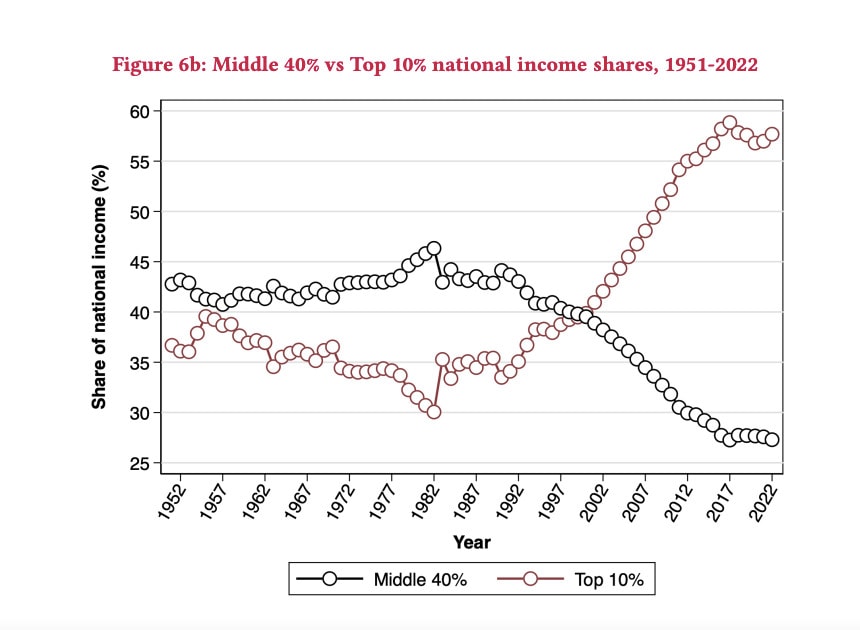
The share of national income going to the top 10 per cent fell from 37 per cent in 1951 to 30 per cent by 1982 after which it began steadily rising. From the early 1990s onwards, the top 10 per cent share increased substantially over the next three decades, nearly touching 60 per cent in the most recent years, the paper said. This compares with the bottom 50 per cent getting only 15 per cent of India’s national income in 2022-23.
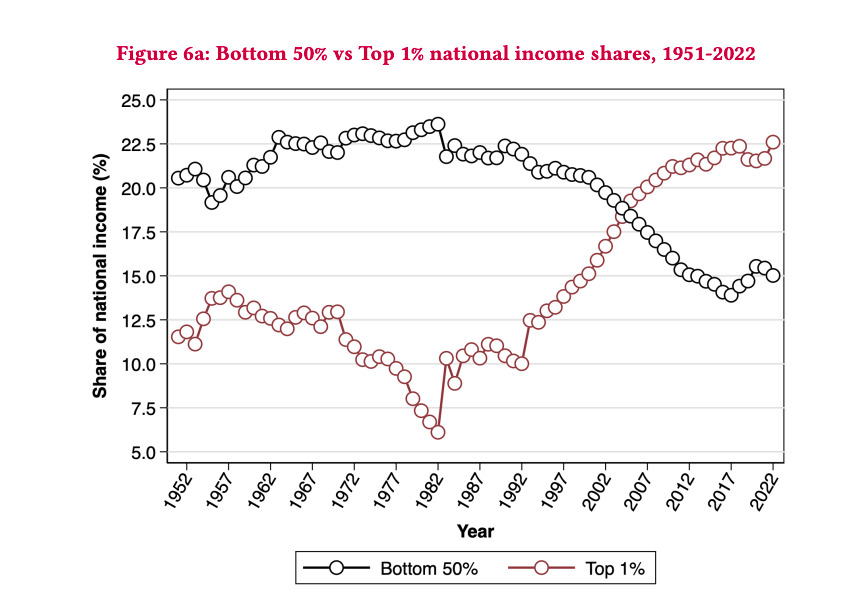
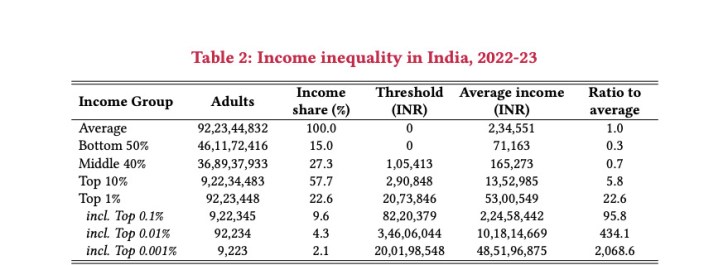
The top 1 per cent earn on average Rs 5.3 million, 23 times the average Indian (Rs 0.23 million). Average incomes for the bottom 50 per cent and the middle 40 per cent stood at Rs 71,000 (0.3 times national average) and Rs 1,65,000 (0.7 times national average), respectively.
The richest, nearly 10,000 individuals (of 92 million Indian adults) earn on average Rs 480 million (2,069 times the average Indian). “To get a sense of just how skewed the distribution is, one would have to be at nearly the 90th percentile to earn the average income in India,” the paper said.
In 2022, just the top 0.1 per cent in India earned nearly 10 per cent of the national income, while the top 0.01 per cent earned 4.3 per cent share of the national income and top 0.001 per cent earned 2.1 per cent of the national income.
Enlisting the probable reasons for sharp rise in top 1 per cent income shares, the paper said public and private sector wage growth could have played a part till the late 1990s, adding that there are good reasons to believe capital incomes likely played a role in subsequent years. For the shares of the bottom 50 per cent and middle 40 per cent remaining depressed, the paper said, the primary reason has been the lack of quality broad-based education, focused on the masses and not just the elites.
“One reason to be concerned with such high levels of inequality is that extreme concentration of incomes and wealth is likely to facilitate disproportionate influence on society and government. This is even more so in contexts with weak democratic institutions. After largely being a role model among post-colonial nations in this regard, the integrity of various key institutions in India appears to have been compromised in recent years. This makes the possibility of India’s slide towards plutocracy even more real. If only for this reason, income and wealth inequality in India must be closely tracked and challenged,” it said.
Some key findings of the paper include:
> Inequality declined post-independence till the early 1980s, after which it began rising and has skyrocketed since the early 2000s.
> Between 2014-15 and 2022-23, the rise of top-end inequality has been particularly pronounced in terms of wealth concentration.
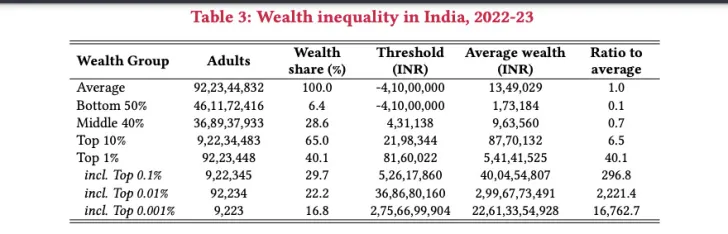
> By 2022-23, top 1 per cent income and wealth shares (22.6 per cent and 40.1 per cent) are at their highest historical levels and India’s top 1 per cent income share is among the very highest in the world, higher than even South Africa, Brazil and US.
> Wealth is highly concentrated even within the top 1 per cent. In 2022-23, the top 1 per cent wealth share was 39.5 per cent, 29 percentage points went just to the top 0.1 per cent, 22 percentage points to just the top 0.01 per cent and 16 percentage points to just the top 0.001 per cent.
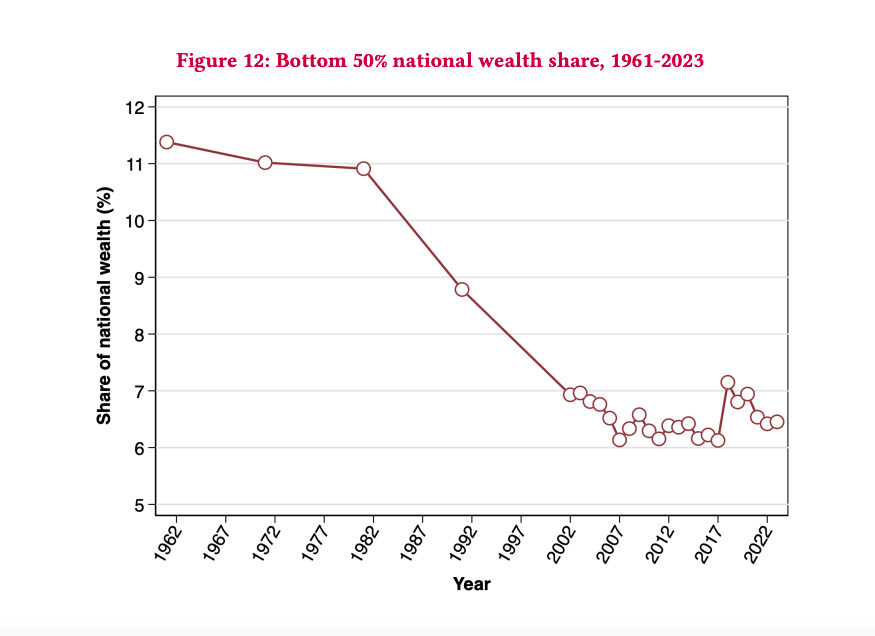
> The sharp rise in top 10 per cent shares from 1991 onwards came at the loss of both bottom 50 per cent and middle 40 per cent shares. From stagnating at 11 per cent during 1961-1981, bottom 50 per cent shares first fell to 8.8 per cent in 1991 and further to 6.9 per cent by 2002. After which, they have hovered between 6-7 per cent over the next two decades with no signs of recovery.
> In 1961, bottom 50 per cent and top 1 per cent shares were identical; by 2022-23, the top 1 per cent share was more than 5 times larger.
> The paper finds suggestive evidence that the Indian income tax system might be regressive when viewed from the lens of net wealth.
> A restructuring of the tax code to account for both income and wealth, and broad-based public investments in health, education and nutrition are needed to enable the average Indian, and not just the elites, to meaningfully benefit from the ongoing wave of globalisation.
> A “super tax” of 2 per cent on the net wealth of the 167 wealthiest families in 2022-23 would yield 0.5 per cent of national income in revenues and create valuable fiscal space to facilitate such investments.
> The quality of economic data in India is notably poor and has seen a decline recently. It is therefore likely that these new estimates represent a lower bound to actual inequality levels.

