
Knowledge Nugget | Swachh Vayu Sarvekshan vs AQI vs SAFAR: How India keeps track of its air
Lucknow has topped the latest Swachh Vayu Sarvekshan. But how does India actually measure “clean air”? Do you know the difference between the National Clean Air Programme (NCAP), Swachh Vayu Sarvekshan, AQI and SAFAR? Go beyond the ranking to understand some must-know data on India’s air-pollution crisis.
 Lucknow topped the national clean-air assessment despite remaining above the PM₁₀ standard. (Image: AI generated)
Take a look at the essential events, concepts, terms, quotes, or phenomena every day and brush up your knowledge. Here’s your UPSC Current Affairs knowledge nugget for today on Air Quality Measurement.
Knowledge Nugget: Air Quality Measurement
Subject: Environment and Ecology (Pollution)
Why in the news?
Lucknow, the capital of Uttar Pradesh, topped the million-plus population category in the 2026 ‘Swachh Vayu Sarvekshan’ for its efforts to improve air quality. The city’s measures included adding electric vehicles to its waste collection fleet, deploying mechanised sweepers to control road dust, and managing legacy waste.

Key takeaways:
1. Indore, India’s cleanest city, secured the second spot, while Jabalpur finished third in the million-plus cities category. Meanwhile, Chennai, Jamshedpur, Kota, Kolkata, and Madurai ranked in the bottom five in this category, while Delhi and Mumbai ranked 30th and 37th, respectively.
2. Although it won the top prize in the million-plus cities category, Lucknow has yet to meet the PM 10 annual ambient air quality standard of 60 ug/m3 (micrograms/cubic metre) prescribed under the national standards, as per the NCAP portal.
3. However, since the programme began, annual PM10 concentrations have declined from 250 ug/m3 in 2017-18 to 137 ug/m3.
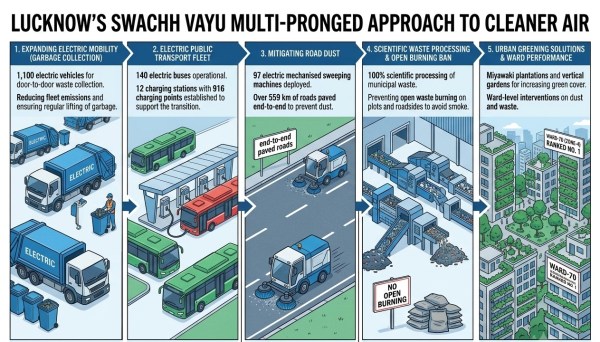 (Infographic generated by AI)
4. Jabalpur’s achievements included a waste-to-energy plant, 100 per cent waste collection and scientific disposal, mechanised street sweeping, and promotion of electric vehicles.
5. Efforts in waste management, road dust control, dust management from construction and demolition waste, and reductions in vehicular and industrial pollution are key parameters used to assess cities for final ranking. Improvements in the reduction of particulate matter 10 concentrations are given only a 2.5 per cent weightage.
6. Of the 130 cities covered under NCAP, only 14 met National Ambient Air Quality Standards in the first target period between 2019 and 2025-26.
7. Of the 131 cities covered under the NCAP, 47 fall in the million-plus city category, 44 in the 3-10 lakh population category, and 40 in the 3 lakh population category.
Air quality management and monitoring in India is undertaken under various programmes, standards and forecasting tools. Let’s know about them in detail here.
What is Swachh Vayu Survekshan?
8. It is an annual assessment of 130 cities under the NCAP. Launched in 2022-23, it is an initiative of the Ministry of Environment, Forests and Climate Change (MoEFCC).
9. The assessment covers measures addressing major pollution sources and implementation of City-specific Clean Air Action Plans. It promotes healthy competition, innovation and accelerated action among cities to improve air quality.
10. Cities and towns are divided into population-based categories: million-plus cities, cities with 3-10 lakh population, and cities with population under 3 lakh. A cash prize and mementoes are awarded to the top three cities or towns.
11. A state-level monitoring committee assesses the cities and towns, the Central Pollution Control Board evaluates them, and independent committees verify them in the field.
How India tracks its air: NCAP, AQI and SAFAR explained
What is the National Clean Air Programme (NCAP)?
1. NCAP was launched in January 2019 by MoEFCC to improve air quality at city, regional and national level and covers over 130 cities.
2. It seeks to achieve annual average ambient air quality standards at all locations in the country in a stipulated timeframe (long-term).
3. The target for these cities is to reduce particulate matter (PM) 10 concentration by up to 40 per cent achievement of NAAQS (60 µg/m3) by 2025-26 compared with 2019-20 levels.
4. Multiple sources of funding disbursed through the Union Environment Ministry, 15th Finance Commission grants, and additional convergence of funds through the Ministry of Housing and Urban Affairs and the Ministry of Heavy Industries are used to improve air quality.
What is National Air Quality Monitoring Programme (NAMP)?
1. The air quality in India is primarily monitored under NAMP, launched in 1984, by the Central Pollution Control Board (CPCB) in coordination with the State Pollution Control Board (SPCB), pollution control committees, and other agencies. It began as the National Ambient Air Quality Monitoring (NAAQM) network before being renamed to NAMP.
2. As per CPCB website, the objectives of the NAMP are:
(i) to determine status and trends of ambient air quality
(ii) to ascertain whether the prescribed ambient air quality standards are violated
(iii) to identify Non-attainment Cities
(iv) to obtain the knowledge and understanding necessary for developing preventive and corrective measures
(v) to understand the natural cleansing process undergoing in the environment through pollution dilution, dispersion, wind based movement, dry deposition, precipitation and chemical transformation of pollutants generated.
3. Under NAMP, four air pollutants viz ., Sulphur Dioxide (SO2), Oxides of Nitrogen as NO2, Respirable Suspended Particulate Matter (RSPM / PM10) and Fine Particulate Matter (PM2.5) have been identified for regular monitoring at all the locations.
4. The monitoring of meteorological parameters such as wind speed and wind direction, relative humidity (RH) and temperature were also integrated with the monitoring of air quality.
5. It is done through both manual monitoring and real-time monitoring through Continuous Ambient Air Quality monitoring stations (CAAQMs).
6. The monitoring of air quality is based on the Ambient Air Quality Standards notified by the CPCB in 2009, which specified permissible limits for 12 pollutants, including Airborne Particulate matter – PM10 and PM2.5.
What are National Ambient Air Quality Standards (NAAQS):
7. Under the provisions of the Air (Prevention & Control of Pollution) Act, 1981, the Central Pollution Control Board (CPCB) notified the fourth version of NAAQS in 2009.
8. These are legally binding technical and regulatory limits set for maximum permissible pollutant concentrations in outdoor air, and includes 12 such pollutants (refer infographic).
9. The national standard aims to provide uniform air quality criteria for all, irrespective of land use patterns, across the country.
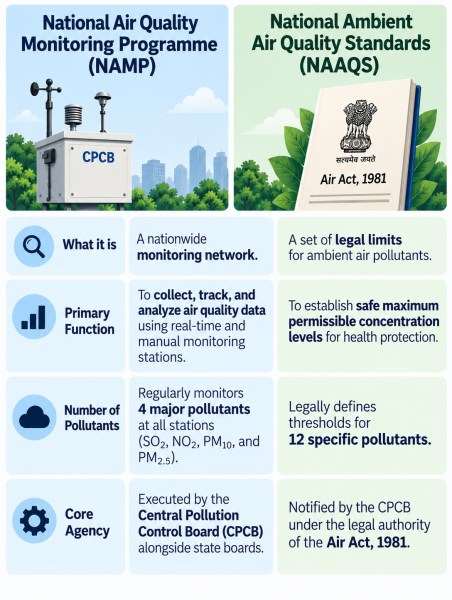 (Infographic generated by AI)
What is Air Quality Index (AQI)?
1. AQI is a number, which is a measure of air quality. The higher the AQI, the worse the air.
2. The colour-coded AQI index was launched in India in 2014 as part of the Swachh Bharat campaign with the aim of ‘One Number – One Color – One Description’ for the general public to judge the air quality within its surroundings.
3. According to the CPCB, part of the MoEFCC, the AQI transforms complex air quality data of various pollutants into a single number (index value), nomenclature and colour.
4. AQI forecast is based on eight pollutants: Particulate matter (PM10), particulate matter (PM2.5), nitrogen dioxide (NO2), sulphur dioxide (SO2), carbon monoxide (CO), ozone (O3), ammonia (NH3) and lead (Pb).
5. There are different categories of AQI, namely ‘Good’ (0-50), ‘Satisfactory’ (50-100), ‘Moderately polluted’ (100-200), ‘Poor’ (200-300), ‘Very Poor’ (300-400), and ‘Severe’ (400-500). A new category of “Severe+ or Emergency” has also been added.
6. The web-based communication system is designed to provide AQI on a real time basis. It is an automated system that captures data from continuous monitoring stations without human intervention, and displays AQI based on running average values.
7. The Air Quality forecast is highly important so that pollution control authorities can initiate action in advance and general public can be made aware.
8. The Graded Response Action Plan (GRAP) ensures that air pollution control actions are taken in Delhi-National Capital Region (NCR) based on the different air quality index categories.
What is the System of Air Quality and Weather Forecasting And Research (SAFAR)?
1. As per its website, SAFAR has been introduced under the plan scheme “Metropolitan Advisories for Cities for Sports, Tourism (Metropolitan Air Quality and Weather Services) by Ministry of Earth Sciences (MoES) for greater metropolitan cities to provide location specific information on air quality in near real time and its forecast 1-3 days in advance for the first time in India.
2. It has been combined with the early warning system on weather parameters. The SAFAR system is developed by IITM, Pune, along with India Meteorological Department (IMD) and National Centre for Medium Range Weather Forecasting (NCMRWF).
3. It monitors PM1, PM2.5, PM10, Ozone, CO, NOx (NO, NO2), SO2, BC, Methane (CH4), Non-methane hydrocarbons (NMHC), VOC’s, Benzene, Mercury. It also monitors meteorological parameters like UV Radiation, Rainfall, Temperature, Humidity, Wind speed, Wind direction, solar radiation
BEYOND THE NUGGET: India’s pollution crisis
1. Air pollution remains a persistent issue in India, with the Delhi-NCR particularly recording some of the worst AQI globally each year. It routinely exceeds the safe level of PM 2.5 (atmospheric particulate matter of diameter of fewer than 2.5 micrometres) and PM 10.
2. According to a recent IQAir report (2025), thirteen out of the world’s twenty most polluted cities are in India, with Byrnihat of Meghalaya as the most polluted in the world.
3. In its 2024 report, the CPCB revealed that during 2022-2023, 50 out of 53 cities with a million plus population recorded annual average PM10 concentration above 50μg/m3. Faridabad (212µg/m³), Delhi (209µg/m³) and Dhanbad (203µg/m³) were among the most polluted cities.
4. It is important to mention here that the World Health Organisation (WHO) recommends that annual mean concentrations of PM10 and PM 2.5 should not exceed 15 µg/m³ and 5 µg/m3 respectively.
Post Read Questions
In the context of WHO Air Quality Guidelines, consider the following statements: (UPSC CSE, 2022)
1. The 24-hour mean of PM2.5 should not exceed 15 µg/m³ and annual mean of PM2.5 should not exceed 5 µg/m3.
2. In a year, the highest levels of ozone pollution occur during the periods of inclement weather.
3. PM10 can penetrate the lung barrier and enter the bloodstream.
4. Excessive ozone in the air can trigger asthma.
Which of the statements given above are correct?
(a) 1, 3 and 4
(b) 1 and 4 only
(c) 2, 3 and 4
(d) 1 and 2 only
Previous year UPSC Mains Question Covering similar theme:
What are the key features of the National Clean Air Programme (NCAP) initiated by the government of India? (UPSC GS3, 2020)
(Sources: mausam.imd.gov.in, cpcb.gov.in, Delhi chokes on pollution: What is AQI — and how is it measured?, Lucknow’s air cleanest, Indore among top 3 in Centre’s annual survey, Lucknow is known for traffic and dust. How did it top India’s clean-air ranking?, Why air pollution should be an urgent national priority)
🚨 Click Here to read the UPSC Essentials magazine for August 2026. Share your views and suggestions in the comment box or at manas.srivastava@indianexpress.com🚨
Subscribe to our UPSC newsletter. Stay updated with the latest UPSC articles by joining our Telegram channel – Indian Express UPSC Hub, and follow us on Instagram and X


Raveena Baneta is a consultant with the UPSC section of The Indian Express where she writes on Ethic... Read More
 Share


