
Sai Life Sciences has a growing pipeline. Can earnings catch up?
Sai Life Sciences has delivered strong growth, with FY26 revenue up 29% and PAT more than doubling. Its discovery business, late-stage pipeline and long-standing pharma relationships are expanding, while a Rs 1,100–1,300 crore capex plan aims to add capacity. But at roughly 50x trailing EV/EBITDA, the key question is whether pipeline conversion, capacity utilisation and margins can keep pace with the valuation.
 The easiest way to understand Sai Life Sciences is to follow a drug through its development journey. (Image generated using AI)
Sai Life Sciences had a breakout year. Revenue grew strongly, but profits grew even faster, more than doubling in FY26. The momentum hasn’t slowed down, with Q1 FY27 continuing to show double-digit growth across revenue and profitability.
At around Rs 1,584 per share, Sai’s market capitalisation is approximately Rs 33,650 crore, and the trailing P/E is above 90x.

That creates an unusual investment setup. The business is showing many of the characteristics investors want in a long-term compounder: high-quality customers, increasing wallet share, strong discovery growth, a growing late-stage pipeline, operating leverage, and a large addressable market. Yet, the valuation leaves little room for execution delays.
Sai Life Sciences: 1-Year Stock Price Movement
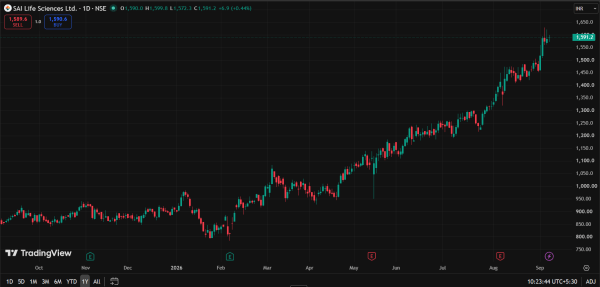 Sai Life Sciences: 1-Year Stock Price Movement (Source: TradingView)
The question, therefore, is whether Sai Life Sciences molecule pipeline can convert into earnings quickly enough for the business to grow into today’s valuation.
The business is best understood as a funnel
The easiest way to understand Sai Life Sciences is to follow a drug through its development journey.
A pharmaceutical company begins with potential molecules in discovery. A small number survive optimisation and preclinical development. Those candidates then move into process development, clinical manufacturing and, if successful, commercial production.
Sai is attempting to participate in as many of these stages as possible.
The company operates as a Contract Research, Development and Manufacturing Organisation (CRDMO). Its discovery business provides chemistry, biology, DMPK (Drug Metabolism and Pharmacokinetics) and other services at the beginning of the drug development cycle. Its Contract Development and Manufacturing Organisation (CDMO) business takes molecules further into process development, clinical supplies, scale-up and commercial API manufacturing.
This distinction is critical because Sai isn’t simply trying to win a manufacturing contract after a molecule has already been developed elsewhere. Increasingly, it wants to be involved much earlier.
The numbers show how significant this business has become. Sai Life Sciences has scaled both sides of its CRDMO platform substantially over the last four years. Discovery revenue nearly tripled from Rs 274 crore in FY22 to Rs 775 crore in FY26, while CDMO revenue more than doubled from Rs 596 crore to Rs 1,417 crore.
| Rs crore | FY22 | FY23 | FY24 | FY25 | FY26 |
| Discovery / CRO | 274 | 467 | 497 | 626 | 775 |
| CDMO | 596 | 760 | 968 | 1,068 | 1,417 |
Commercial manufacturing revenue is inherently lumpy because purchase orders, production campaigns and molecule launches do not occur evenly across quarters. Sai’s management expects the second half of FY27 to be stronger as new capacity comes online and commercial programmes ramp up.
The important question therefore is not whether CDMO grows every quarter at the same rate, but whether more molecules are progressively moving down the funnel.
The discovery business could be the leading indicator
Discovery revenue grew 24% in FY26 and another roughly 24-26% in Q1 FY27. More importantly, the company says more than 65% of its discovery customers now use multiple services.
That is significant because Sai has deliberately invested in expanding beyond chemistry. Management has spent years building capabilities in biology and DMPK so that it can provide more integrated services to customers rather than competing for individual projects.
This strategy is beginning to show results.
During Q1, Sai converted a pilot engagement with a large pharmaceutical customer into a long-term, high-volume discovery chemistry partnership. Management also said multiple customers expanded their relationships during the quarter, indicating that growth was not dependent on a single account.
This matters because the objective is not simply to increase the number of discovery projects but to increase the depth of each customer relationship.
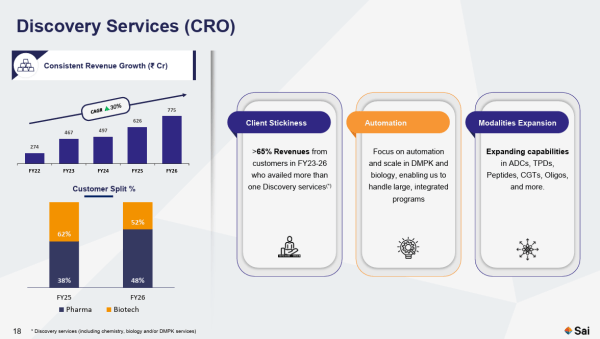 Source: Q1 FY27 Investors Presentation
If Sai can move from providing one chemistry service to providing integrated discovery services, it becomes involved in more of the customer’s development process. And the deeper the scientific relationship becomes, the greater the possibility that a successful molecule progresses into development and eventually manufacturing.
That is the real economic opportunity.
The FTE model may be the missing link
The most important disclosure in Q1 may have been around Sai’s FTE (Full-Time Equivalent) model, where dedicated scientific teams work continuously on a customer’s drug development programmes.
Over the last 15 months, Sai added six late-phase molecules to its pipeline. Five came from large-pharma customers with whom it already had FTE relationships. That may be more important than the headline CRO growth rate because it suggests discovery relationships are beginning to feed Sai’s downstream pipeline.
Instead of approaching a pharma company only when it needs manufacturing capacity, Sai gets involved while the molecule is still being developed. If the molecule progresses, Sai already understands its chemistry and development history, creating a natural pathway:
Discovery → FTE → Development → Clinical Supply → Commercial Manufacturing
The economics can change dramatically along this journey. A discovery engagement may initially be small, but a successful molecule can generate development and manufacturing revenue for years.
This is why ‘win the molecule early’ captures Sai’s strategy so well. The company is effectively trying to build tomorrow’s manufacturing pipeline before the revenue exists.
Early evidence that the strategy is working
Sai currently has 33 active commercial molecules and 14 late-phase molecules in its CMC pipeline. The company says production has already commenced for three of the four molecules added to the pipeline last year. Sai also supported five FDA-approved molecules in 2025 and 17 launches over the past five years.
These numbers don’t guarantee future revenue, but they demonstrate that the discovery-to-commercialisation model is already producing tangible outcomes.
The 14 late-phase molecules are particularly useful to track because they sit much closer to commercialisation than an early-stage pipeline.
If that number steadily rises, while CRO remains strong, it would provide increasing evidence that the top of Sai’s funnel is successfully feeding the bottom.
Customer stickines
There is a second set of numbers that makes Sai’s model particularly interesting.
More than 90% of revenue came from returning customers in both FY25 and FY26. Sai works with 300+ active customers, including 19 of the world’s top 25 pharmaceutical companies, while its large-pharma relationships have an average tenure of more than 11 years.
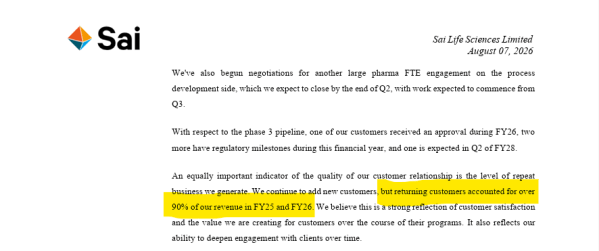 Source: Q1 FY27 Concall Transcript
More importantly, revenue from these 19 large-pharma customers rose from 28% of total revenue in FY22 to 49% in FY26. This suggests Sai can grow not just by adding customers, but by increasing its share of wallet within existing relationships.
That can happen by adding discovery services, moving customers into FTE engagements, taking molecules into process development, and eventually manufacturing commercial APIs.
In a business where relationships can last a decade or more, expanding the work done for existing customers can be more valuable than simply increasing customer count. The combination of high customer retention and growing revenue per customer is becoming an increasingly important part of Sai’s growth story.
FY26 Operating leverage
The financial progression is where Sai’s story starts becoming particularly interesting.
| Rs crore | FY25 | FY26 | YoY |
| Revenue | 1,695 | 2,192 | 29.3% |
| EBITDA | 425 | 661 | 55.5% |
| EBITDA margin | 25.1% | 30.1% | 500 bps |
| PAT | 170 | 355 | 108.9% |
Source: Q1 FY27 Investor presentation
Revenue grew 29%, but EBITDA grew almost twice as fast at 56%, while PAT more than doubled. The expansion to a roughly 30% EBITDA margin points to meaningful operating leverage as Sai’s infrastructure gets better utilised and its mix shifts toward higher-value development and manufacturing programmes.
That momentum continued into Q1 FY27.
| ₹ crore | Q1 FY26 | Q1 FY27 | Q1 FY27 |
| Revenue | 496 | 554 | 11.7% |
| EBITDA | 125 | 148 | 18.4% |
| EBITDA margin | 25% | 27% | 200bps |
| PAT | 60 | 73 | 21.7% |
Source: Q1 FY27 Investor Presentation
The important caveat is that Sai’s margins are inherently lumpy. EBITDA reached 34% in Q3 FY26 before coming down to 27% in Q1 FY27. Management attributes this variability largely to the mix and timing of commercial manufacturing campaigns, rather than a fundamental deterioration in the business.
The more important question is whether Sai can sustain healthy revenue growth while steadily improving utilisation and maintaining EBITDA margins in the high-20s. If it can, FY26 could prove to be less of a one-off earnings spike and more the beginning of a structural improvement in the company’s earnings power.
The Rs 1,100-1,300 crore capex programme
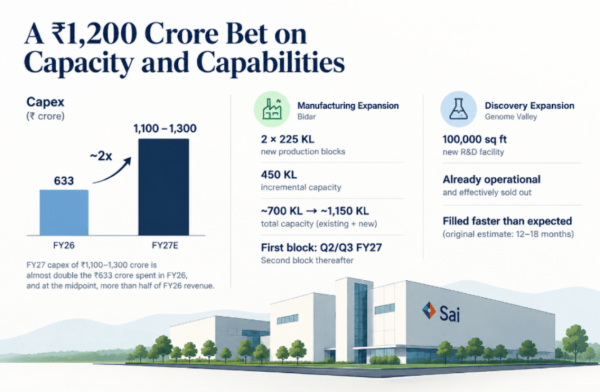
The most consequential decision management has made for FY27 is its planned Rs 1,100-1,300 crore capex, almost double the Rs 633 crore invested in FY26. At the midpoint of Rs 1,200 crore, that is more than half of FY26 revenue, making this far more than a routine capacity expansion. The investment spans both manufacturing capacity and scientific capabilities, reflecting management’s confidence in the demand it sees ahead.
At Bidar, Sai is adding two 225 KL production blocks, creating 450 KL of incremental capacity. With the existing ~700 KL footprint, total capacity should eventually reach around 1,150 KL.
Management expects the first block to come online around Q2/Q3 FY27, with the second following thereafter. The company is also expanding its discovery platform through a new 100,000 sq ft R&D facility at Genome Valley, which is already operational and, according to management, effectively sold out. This is notable because the original expectation was that the facility would take roughly 12-18 months to fill.
 Source: Author illustrations
The early evidence from the expansion is therefore encouraging: discovery capacity appears to be getting absorbed faster than expected, while manufacturing capacity is being built against visible demand. But the bigger question is still ahead. Sai now has to convert this large investment into higher utilisation, revenue and returns on capital.
Return on capital
This is where investors should focus. The question isn’t whether Rs 1,200 crore of capex will add capacity, but whether that capital will generate attractive incremental returns.
With utilisation at around 65%, Sai still has headroom even as it adds substantial new capacity. The bull case therefore depends on the pipeline growing fast enough to absorb it. If late-phase molecules progress, commercial additions accelerate and the first 225 KL block ramps quickly, fixed costs can be spread across higher production, creating significant operating leverage.
The risk is the opposite: delayed clinical programmes or commercial launches could leave Sai carrying depreciation on new assets before sufficient revenue arrives, depressing free cash flow and returns on capital.
For FY27-29, the key metric is therefore capacity absorption. The new discovery facility filling faster than expected is an encouraging leading signal. The next test is whether Bidar’s new capacity fills at a similar pace.
Optionalities
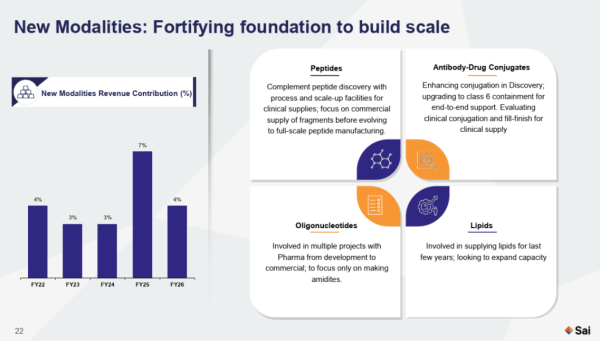
Sai is also investing in peptides, ADCs, oligonucleotides and formulations.
The peptide strategy is particularly interesting because management is explicitly trying to avoid building the opportunity solely around GLP-1 drugs. The company is targeting broader peptide applications and plans to develop capabilities across discovery, development and commercial manufacturing.
A dedicated peptide manufacturing facility is targeted for 2028.
However, investors should be careful not to capitalise these businesses as though they already exist at scale.
 Source: Q1 FY27 Investors Presentation
New modalities currently account for only a small proportion of revenue.
Their importance today is strategic rather than financial.
If Sai can offer customers peptides, formulations and other modalities in addition to its existing small-molecule capabilities, it increases the amount of the customer’s development lifecycle that Sai can potentially capture.
That makes these businesses optionality on top of the existing thesis, rather than the thesis itself.
China+1 is a catalyst
The China+1 opportunity is becoming more than simply “India replacing China.” Supply-chain concentration in China has increasingly become a strategic risk, with the U.S. BIOSECURE Act turning part of that concern into policy. The June 2026 addition of WuXi AppTec to the U.S. Department of Defense’s 1260H list further highlights the geopolitical pressure on pharmaceutical supply chains.
For Sai, the opportunity isn’t simply to offer additional manufacturing capacity. Global pharma companies need scientific expertise, process development, quality systems and regulatory credibility alongside manufacturing.
This is where Sai’s positioning becomes interesting. Its platform spans discovery, process development, clinical supplies and commercial manufacturing, supported by long-standing relationships with global pharma. If customers increasingly consolidate outsourcing with fewer strategic partners, Sai could capture more of each molecule’s lifecycle.
The opportunity, therefore, isn’t just replacing Chinese manufacturing. It is capturing more of the molecule’s lifecycle.
Valuations
This is where the Sai thesis becomes a little harder to stomach.
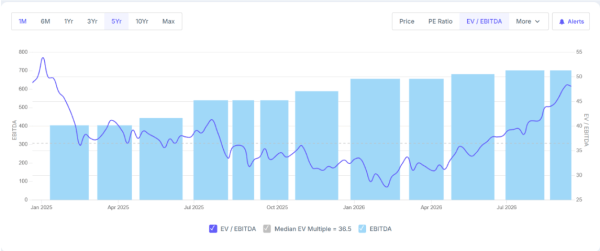
Management is targeting 15-20% revenue growth and 28-30% EBITDA margins over the next three to five years. The business may warrant a premium given its growth, customer quality, and integrated CRDMO model. The question is how much of that growth and quality is already reflected in the share price.
 Source: http://www.screener.in
At a market capitalisation of roughly Rs 33,650 crore and enterprise value of around Rs 33,700 crore, Sai trades at approximately 50x trailing EV/EBITDA.
| Company | EV/EBITDA |
| Syngene | ~16.7x |
| Neuland Laboratories | ~36.3x |
| Sai Life Sciences | ~47.7x |
| Divi’s Laboratories | ~55.5x |
Source: www.screener.in
The premium is substantial. Sai trades well above Syngene and Neuland, and close to Divi’s, one of India’s strongest CDMO and API franchises.
That premium is not necessarily unjustified. Sai delivered 29% revenue growth and 56% EBITDA growth in FY26, while its integrated model offers the potential to capture a larger share of a molecule’s lifecycle.
But at roughly 50x current EBITDA, the margin for disappointment is limited. Any meaningful shortfall in capacity utilisation, pipeline conversion or margins could make the high starting multiple more difficult to sustain.
The investment debate therefore rests less on whether Sai is a high-quality business and more on whether its current earnings justify a valuation that already assigns it a substantial premium to most listed Indian CRDMOs.
What investors should track every quarter
Investors should track six indicators: CRO growth, FTE-to-late-stage conversion, commercial molecule additions, capacity utilisation, EBITDA margins, and free cash flow/ROCE. Mid-20% CRO growth and sustained conversion would signal a healthy funnel, while rising commercial molecules and utilisation would show execution. EBITDA margins should remain on track toward the 28-30% target despite new-facility depreciation. Finally, FCF and ROCE will determine whether the Rs 1,100-1,300 crore investment programme is creating value. If these indicators move together, the current valuation becomes easier to assess.
Note: We have relied on data from http://www.screener.in and http://www.tijorifinance.com throughout this article. Market price and market capitalisation data are from Thurro. Only in cases where the data was not available, have we used an alternate, but widely used and accepted source of information.
Rahul Rao has helped conduct financial literacy programmes for over 1,50,000 investors. He also worked at an AIF, focusing on small and mid-cap opportunities.
Disclosure: The writer or his dependents do not hold shares in the securities/stocks/bonds discussed in the article.
The website managers, its employee(s), and contributors/writers/authors of articles have or may have an outstanding buy or sell position or holding in the securities, options on securities or other related investments of issuers and/or companies discussed therein. The content of the articles and the interpretation of data are solely the personal views of the contributors/writers/authors. Investors must make their own investment decisions based on their specific objectives, resources and only after consulting such independent advisors as may be necessary.

 Share


