How Gerardus Mercator, a man who never travelled far, mapped the world
Flemish geographer Gerardus Mercator’s map offered a solution to a problem that had long troubled map-makers: how to represent the curved surface of the globe on a flat chart.
Gerardus Mercator and his 1595 atlas (Wikipedia, edited by Abhishek Mitra)
Last week, the UN General Assembly voted to replace Mercator’s world map with one that reflects Africa’s size more accurately. Since 1569, the Mercator projection – a map design by Flemish geographer Gerardus Mercator – has been the subject of heated debate, particularly over the distortions it introduces in the size of countries and continents. In On The Map: Why the World Looks the Way it Does (2012), author Simon Garfield asks, “Well, what is the good of Mercator’s famous world map of 1569? It’s riddled with distortions and full of countries many times larger than they really are.”
INTERACTIVE · TAP TO COMPARE
Mercator vs. Reality
Greenland
Appears comparable in size to South America
Europe
Shown roughly twice its true size
Africa
Appears comparatively diminished
North America
Appears as a sprawling behemoth
Polar Regions
Stretched across the map's full width, top and bottom
Greenland
In reality, only a fraction of South America's area
Europe
Actual size much smaller than the map depicts
Africa
Its true scale is lost in the projection's distortion
North America
Far smaller, relative to other landmasses, than shown
Polar Regions
The poles do not stretch infinitely — that's an artefact of the projection, not real geography
Note: The comparative descriptions (e.g. "roughly twice its true size") come from source reporting; no precise multipliers were given there. The maps above use real country boundary data rendered in the Mercator and Equal Earth projections — the projection the UN's September 2026 resolution encourages adopting — confirmed via independent reporting since the source article did not name it.
And yet, it remains the map we use today. “Countries have been added of course, and the shapes of coasts and borders have been corrected and politically adjusted, but the map that shaped the end of the Renaissance, saw in the Enlightenment and adorned Victorian classrooms remains the display of choice, right through to the latest Google Maps,” Garfield adds.
Advertisement
From philosophy to maps
What Mercator created in 1569 was not simply a map, but a projection of the world and a template for future maps. There is, however, an irony to this. British historian Jerry Brotton writes in A History of the World in 12 Maps (2012), “Throughout his long life, his travels never took him further than a 200 kilometre radius away from his birthplace of Rupelmonde, a small town on the bank of the River Scheldt in the modern-day Belgian region of East Flanders, where he was born in 1512 and named Gerard Kremer [or Gerardus Mercator].” When he laid out his famous world projection in 1569, at the age of 57, he had produced fewer than ten maps.
Rupelmonde, now in Belgium (Wikipedia)
Although Mercator regarded himself as a cosmographer, he was initially drawn to philosophy. Realising that a career in philosophy offered limited prospects, he turned instead to astronomy and mathematics.
By 1533, he was in Antwerp, studying both disciplines and beginning his association with a group of men who would help transform him from an aspiring philosopher into a geographer.
Advertisement
“These were the members of the first generation of Flemish geographers who, following (Portuguese explorer Ferdinand) Magellan’s voyage, were trying to project the terrestrial world onto globes as well as maps,” notes Brotton.
Mercator: The Man and The Mechanism
The Man
1512
Born Gerard Kremer in Rupelmonde, East Flanders (modern-day Belgium)
200 km
Farthest he ever travelled from his birthplace, his entire life
Age 57
When he produced his famous 1569 world projection — after fewer than 10 prior maps
1594
Died at 82; his son Rumold published his completed Atlas the following year
The Mechanism
The Problem
How to represent a curved globe's surface on a flat chart — a navigator on a constant course actually sails an endless curve
The Breakthrough
His Conformal projection kept all angles straight by spacing latitude lines further apart moving away from the Equator
The Payoff
Rhumb lines could now be drawn as straight lines, matching a ship's constant compass heading
The Map Itself
18 sheets
Engraved panels making up the full wall map
~2m × 1.3m
Approximate assembled size of the map
Note: Source does not specify an exact date for the UN General Assembly's vote to replace the Mercator projection, only "last week."
Mercator was also drawn to copperplate engraving, a technique that was transforming cartography. “The effect on mapmaking was immediate. Copperplate engraving transformed the appearance of maps and globes,” notes Brotton.
His earliest maps were collaborative works. In his first independent map, Mercator turned from political geography to religion. In 1538, he published an engraved wall map of the Holy Land, designed, according to its title, ‘for the better understanding of the Bible’. It allowed Mercator to pursue his interest in theology while also being lucrative: no regional maps sold better than those of the Holy Land. In 1541, he devised a navigator’s globe on which rhumb lines spiralled outward from compass roses.
The 1569 Mercator map of the world (Wikipedia)
But it was his 1569 projection that truly set him apart. It revolutionised navigation by allowing rhumb lines—an arc crossing all meridians of longitude at the same angle—to be represented as straight lines on a flat map. Brotton writes, “Mercator’s 1569 projection may be the most influential map in the history of geography, but it was also one of the most peculiar. Nothing prepared Mercator’s contemporaries for such a strange object: not its scale, its appearance, or its claims ‘for use in navigation’.”
The world made flat
Engraved on 18 sheets and intended to hang on a wall, the map measured more than 2 metres in length and nearly 1.3 metres in height when assembled. But the map’s significance lay beyond its size.
Its main attribute was technical. It offered a solution to a problem that had troubled map-makers since the world was recognised as a sphere: how to represent the curved surface of the globe on a flat chart. The established grid of latitude and longitude worked well for theoretical coordinates, but a navigator following a constant course sailed along an endless curve.
Garfield writes, “Mercator had already displayed this curving course on his globes through his rings or ‘rhumb’ lines, and now he wanted to convert them to a map, and enable any navigator to swiftly locate his position and find his way to any destination”
Globe with rhumb lines (Wikipedia)
Rhumb lines were not the only method of navigating across the earth’s surface, but the existing methods became increasingly impractical beyond the Mediterranean, leaving sailors so far adrift that a better solution was needed.
Mercator’s map drew heavily on Roman astronomer Ptolemy’s gazetteer while incorporating recent discoveries, notably the outline of North America. But, “his enduring breakthrough,” finds Garfield, “was his new Conformal projection, the method by which he manoeuvred his latitudinal rings to keep all the angles straight (the lines of latitude became further apart as they moved from the Equator). Mariners would thus be able to navigate across the map in straight lines, in keeping with the desired direction of their flickering compass.”
Mercator was also working on an atlas. Five months after he died in 1594, at the age of 82, his son Rumold published the completed work in 1595. According to Brotton, “Mercator’s Atlas still deserves its description as the first modern atlas”
The politics of a map
The projection was not flawless. Among its most obvious distortions was the exaggerated size of land masses at higher latitudes. North America appeared as a sprawling behemoth, while Europe was roughly twice its true size and Africa comparatively diminished. Greenland appeared comparable in size to South America, when in reality it is only a fraction of its area.
“Even more peculiar is Mercator’s depiction of the polar regions, which were shown running the full width of the map’s top and bottom, making no apparent concession at all to the earth’s sphericity,” writes Brotton.
An updated version of the 1554 map of Europe as it appears in the 1595 atlas (Wikipedia)
The projection came under renewed scrutiny in the 20th century. “A stronger impetus for the Mercator map’s decline was the war with Germany and Japan, which heightened public awareness of relative distance and cartographic perspective,” writes Mark Monmonier in Rhumb Lines and Map Wars: A Social History of the Mercator Projection (2004). Media critics subsequently attacked the projection for its scale distortions and its exaggerated separation of the United States from Europe and Asia.
But perhaps the most persistent criticism of the Mercator map has been its alleged Eurocentrism. Speaking with indianexpress.com, Monmonier says: “Horizontally, any projection centred on the Greenwich meridian is also centred on Africa. Vertically, any cylindrical projection on which the poles lie an infinite distance from the equator can be configured with Europe at the centre. Insist on showing all of Greenland and not a hint of Antarctica, and a Mercator map becomes Eurocentric.”
The projection, however, also has its defenders. Garfield writes, “The things that look wrong to us now–Greenland the size of Australia rather than a third of it, an Antarctic continent that bumps raggedly and indefinitely along the base–were not the strangest things then, for exact proportionate sizes were not yet known and the polar regions were but dismal myth”.
The map that endures
The projection’s resilience is remarkable given the forces that have challenged it over the last 450 years. Even Google found Mercator’s neat and symmetrical rectangles perfectly suited to the pixelated tiles that make up a digital map.
Garfield asks in his work, “Will one projection emerge victorious? It’s already happened. Mercator’s map casts its shadow over the digital world just as it did in the world of those navigators opening up new trade routes half a millennium ago, and the possibilities for its future manipulation are therefore limitless. It is the projection used not only by Google Maps, but also (with a spherical interpretation) by its rivals, Microsoft’s Bing and OpenStreetMap.”
“Any alternative [map] would have to be imposed centrally by a court bigger than the United Nations, whose logo, incidentally, is a projection of a globe centred on the Arctic Circle and wreathed in olive branches that first appeared twelve years after Mercator’s,” writes Garfield.
Asked whether we are being too harsh on Mercator, Monmonier’s answer is simple: “In one word, I would say yes.”

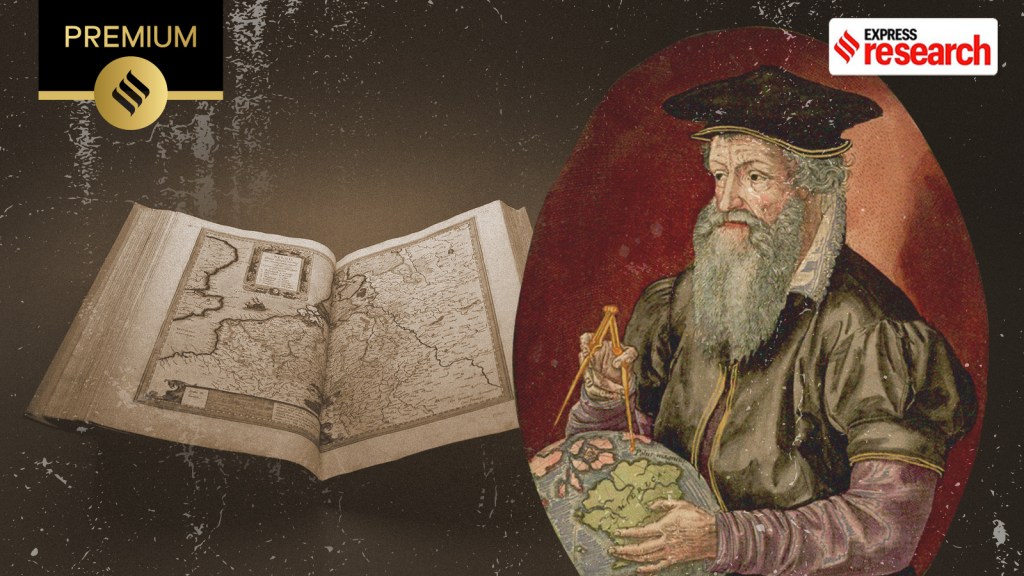 Gerardus Mercator and his 1595 atlas (Wikipedia, edited by Abhishek Mitra)


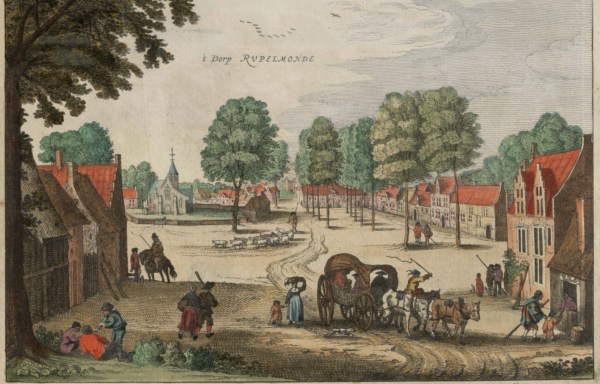 Rupelmonde, now in Belgium (Wikipedia)
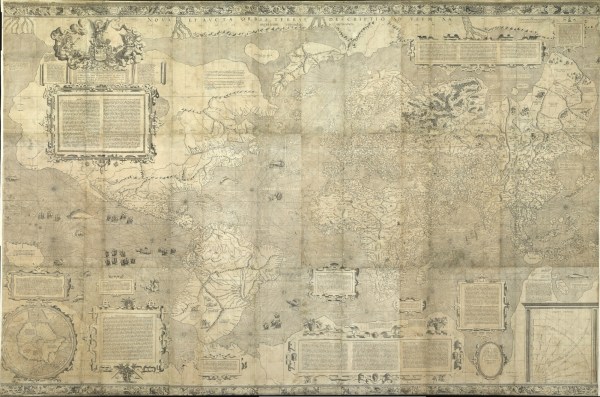 The 1569 Mercator map of the world (Wikipedia)
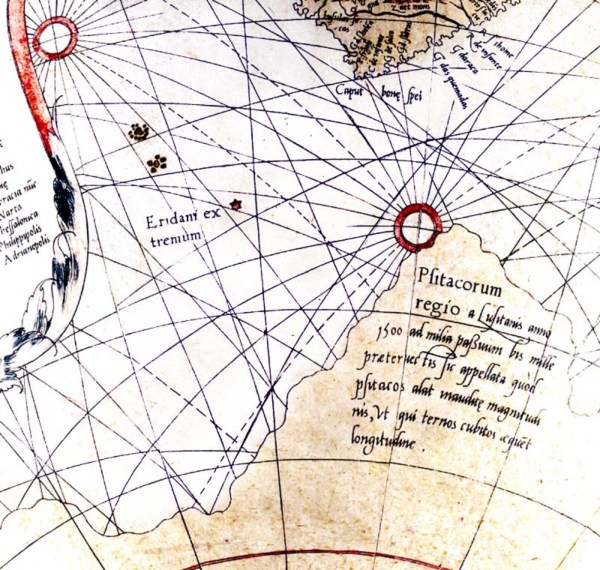 Globe with rhumb lines (Wikipedia)
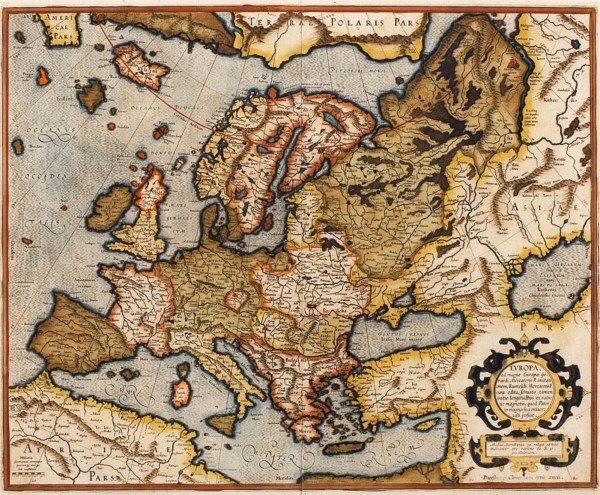 An updated version of the 1554 map of Europe as it appears in the 1595 atlas (Wikipedia)


 Share


